
Hydrologic Benchmark Network Stations in the Western U.S. 1963-95 (USGS Circular 1173-D)
To download a printer friendly PDF version of this information click here.
This report details one of the approximately 50 stations in the Hydrologic Benchmark Network (HBN) described in the four-volume U.S. Geological Survey Circular 1173. The suggested citation for the information on this page is:
|
Mast, M.A., and Clow, David W., 2000, Environmental characteristics and water-quality of Hydrologic Benchmark Network stations in the Western United States, U.S. Geological Survey Circular 1173-D, 115 p. |
All of the tables and figures are numbered as they appear in each circular. Use the navigation bar above to view the abstract, introduction and methods for the entire circular, as well as a map and list of all of the HBN sites. Use the table of contents below to view the information on this particular station.
|
Table of Contents |
| 1. Site Characteristics and Land Use |
| 2. Historical Water Quality Data and Time-Series Trends |
| 3. Synoptic Water Quality Data |
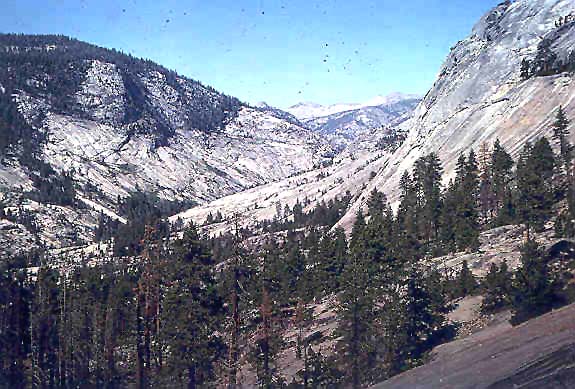
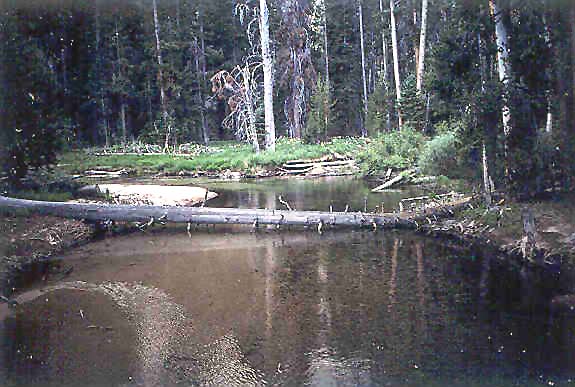
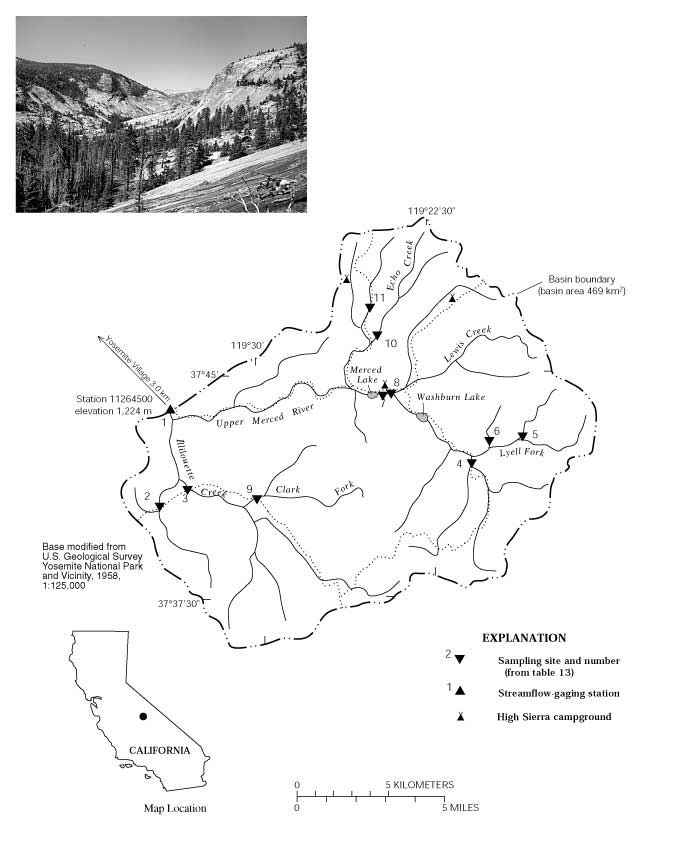
The Merced River HBN Basin is located on the western slope of the central Sierra Nevada, in the Sierra-Cascade Mountains physiographic province in central California (Figure 6. Map showing study area in the Merced River Basin and photograph showing the Echo Creek subbasin). The basin drains an area of 469 km² and ranges in elevation from 1,224 to 3,997 m. The landscape in the Merced River Basin is alpine-subalpine-montane and is characterized by broad glaciated valleys with steep-sided walls. Forests and meadows mainly cover the alluvial areas along the valley floors, and the ridges have broad expanses of exposed granite and thin patches of forest. Headwater
 |
The basin is located in the Sierran Steppe-Mixed Forest-Coniferous Forest-Alpine Meadow ecoregion (Bailey and others, 1994) and vegetation is dominated by old-growth pine and fir vegetation types (Rundel and others, 1977). Less than one-half of the basin area is forested and the remainder is covered by lakes, wetlands, meadows, rock outcrops, and talus slopes (Rundel and others, 1977). In the montane zone, which ranges from about 1,500 to 2,700 m, the predominant trees are ponderosa pine, Jeffrey pine, Douglas-fir, sugar pine, white fir, California red fir, and incense cedar. In the subalpine zone (about 2,700 to 3,200 m), the predominant trees include mountain hemlock, California red fir, lodgepole pine, western white pine, and whitebark pine. In the alpine zone, above about 3,200 m, vegetation consists of low-lying tundra plants and alpine meadow vegetation. Soils in the basin are Inceptisols, which mostly developed on alluvial deposits and glacial tills derived from the local bedrock. The soils are usually shallow, coarse textured, dark colored, and acidic and have variable organic-matter content. Most of the soils are highly permeable, except for meadow soils, which are poorly drained. Cryumbrepts form predominantly in granitic colluvium on ledges, on ridge slopes, and in joint systems on large rock outcrops (Huntington and Akison, 1987). These soils usually have a thick, dark-colored surface layer overlying lighter colored substrata that rest on coarse boulders or slightly weathered granite rock at depths ranging from 50 to more than 150 cm. Cryochrepts and Cryorthents are developed on hillslopes
 |
The Sierra Nevada are formed by Cretaceous-age granitic rocks of the Sierra Nevada Batholith (Huber, 1987; Bateman, 1992). Most of the rocks in the upper Merced River Basin are granites and granodiorites that are part of the Tuolumne Intrusive Suite, a group of four concentrically arranged plutons (Huber, 1987). The oldest and most mafic unit forms the margin of the suite and is present in the southwest part of the basin. The rocks are progressively younger and more felsic toward the core of the suite, which underlies the basin near the northern boundary. The predominant minerals in the granodiorites are plagioclase, biotite, and hornblende; the predominant minerals in the granites are plagioclase, quartz, potassium feldspar, biotite, and hornblende. Small outcrops of hornfels and other metavolcanic rocks were probably derived from pyroclastic rocks (tuff and breccia) that underlie the southeastern part of the basin. Limited exposures of metasedimentary rocks and diorite crop out along the eastern margin of the basin. About 20 percent of the basin is underlain by surficial deposits, which primarily include glacial till that covers the valley bottoms as lateral and recessional moraines. Till is particularly extensive in the drainage basin of Illilouette Creek (fig. 6). Talus and colluvium form substantial deposits in high-elevation cirques, especially along the Sierran Divide, which forms the eastern boundary of the basin.
The Merced River HBN Basin drains the eastern parts of Mariposa and Madera Counties in California and is entirely within the boundaries of Yosemite National Park. The only road in the basin follows the western margin of the park, providing access to a scenic overlook. An extensive trail system provides access to much of the basin during the summer, but deep snowpacks limit accessibility during the winter. The trail system and three large campgrounds (capacity of more than 50 people per night) are heavily used during the summer. The campgrounds are operated by concessionaires as semipermanent installations that have showers and water-treatment facilities. The basin is managed solely for wilderness and recreation because of its location in a national park. Forest fires, floods, and landslides are the main natural disturbances in the basin. Possible human effects primarily are trail erosion caused by people and pack animals, which may result in siltation of surface water.
The data set for the Merced River HBN station analyzed for this report includes 212 water-quality samples that were collected from February 1968 through September 1995. Sampling frequency ranged from bimonthly to biweekly from 1969 to 1982, then was decreased to quarterly from 1983 to 1995. Samples from the early part of the period of record probably were analyzed at a USGS district laboratory in Sacramento, Calif. (Durum, 1978). After establishment of the central laboratory system, samples were analyzed at the Salt Lake City, Utah, laboratory from 1973 to 1975 and at the NWQL in Arvada, Colo., from 1976 through 1995. Daily discharge records for the Merced River (station 11264500) are available beginning in August 1915. Daily water temperature at the station was measured from October 1965 to September 1977 and October 1978 to September 1993.
Calculated ion balances for 202 samples that have complete major-ion analyses are shown in figures 7a and 7b. Graphs showing temporal variation of discharge, field pH, major-ion concentrations, and ion balance in the Merced River, California. Ion balances ranged from -61 to +42 percent, and only 60 percent of the samples had values within the ±10-percent range. This wide range of ion balances reflects the difficulty in making precise analytical measurements at the low solute concentrations typical of this station. The average ion balance was -6.3 percent, and more than 65 percent of the samples had negative ion balances, indicating an excess of measured anions over cations in
 |
[Concentrations in units of microequivalents per liter, discharge in cubic meters per second, specific conductance in microsiemens per centimeter at 25 degrees Celsius, pH in standard units, and silica in micromoles per liter; n, number of stream samples; VMW, volume-weighted mean; inst., instantaneous; spec. cond., specific conductance; <, less than; --, not reported]
| Parameter | Stream Water | Precipitation VMAa | |||||
| Minimum | First Quartile | Median | Third Quartile | Maximum | n | ||
| Discarge, inst. | 0.054 | 0.96 | 3.3 | 13 | 82 | 210 | -- |
| Spec. cond., field | 3.0 | 14 | 22 | 30 | 65 | 207 | 4.5 |
| pH, field | 5.6 | 6.5 | 6.8 | 7.0 | 8.0 | 206 | 5.4b |
| Calcium | 10 | 65 | 110 | 150 | 320 | 209 | 2.3 |
| Magnesium | <8.2 | 8.2 | 16 | 25 | 66 | 208 | 1.2 |
| Sodium | 4.4 | 44 | 78 | 110 | 180 | 211 | 3.8 |
| Potassium | <2.6 | 5.1 | 10 | 13 | 26 | 210 | .3 |
| Ammonium | <.7 | .7 | 2.1 | 4.3 | 16 | 100 | 7.5 |
| Alkalinity, laboratory | 20 | 100 | 140 | 180 | 360 | 209 | -- |
| Sulfate | <4.2 | 17 | 23 | 37 | 120 | 209 | 5.9 |
| Chloride | 2.8 | 25 | 68 | 110 | 280 | 212 | 4.1 |
| Nitrite plus nitrate | <.7 | 2.1 | 3.6 | 7.1 | 32 | 163 | 7.7c |
| Silica | 15 | 70 | 100 | 130 | 250 | 185 | -- |
a Values are volume-weighted mean concentrations for 1982-95.
b Laboratory pH.
c Nitrate only.
The median concentrations and ranges of major dissolved constituents in stream water collected at the HBN station and VWM concentrations in wet-only precipitation measured at the Yosemite National Park NADP station are presented in table 10. Precipitation chemistry at the NADP station, which is about 25 km northwest of the HBN station at an elevation of 1,408 m, is very dilute and slightly acidic and has a VWM pH of 5.4 for 14 years of record. The predominant cation in precipitation was ammonium, which contributed 39 percent of the total cation charge, and the predominant anion was nitrate, which accounted for 44 percent of the total anions. The predominance of these ions in precipitation may reflect the influence of agricultural activities in the San Joaquin Valley on the western side of the Sierra Nevada.
Stream water in the Merced River is dilute and weakly buffered; specific conductance ranged from 3.0 to 65 mS/cm, and alkalinity ranged from 20 to 360 meq/L (table 10). The major cations in stream water were calcium and sodium
 |
The solute composition of stream water was further evaluated by analyzing correlations between solutes and stream discharge (table 11). Most weathering-derived solutes had strong inverse correlations with stream discharge, particularly calcium (rho = -0.806) and sodium (rho = -0.796). These results are consistent with a hydrologic system where weathering-enriched base flow is diluted by water from shallow or surficial sources during periods of increased discharge, particularly spring snowmelt. Chloride also had a strong inverse correlation with discharge (rho = -0.842), providing additional evidence for the effect of chloride-rich ground-water springs on the chloride concentration of the stream (Clow and others, 1996). For the solutes, the strongest correlations were between calcium and sodium (rho = 0.886), calcium and chloride (rho = 0.901), and sodium and chloride (rho = 0.893). These strong correlations may indicate a common source of these solutes, such as saline springs discharging from joints and fractures in the bedrock. Calcium and sodium also had strong positive correlations with silica, which is consistent with the weathering stoichiometry of plagioclase in the granitic bedrock.
[Q, discharge; Ca, calcium; Mg, magnesium; Na, sodium; K, potassium; Alk, alkalinity; SO4, sulfate; Cl, chloride; Si, silica]
|
|
|
|
|
|
|
|
|
|
|
| pH | -0.212 | -- | -- | -- | -- | -- | -- | -- | -- |
| Ca | -.806 | 0.178 | -- | -- | -- | -- | -- | -- | -- |
| Mg | -.417 | .137 | .436 | -- | -- | -- | -- | -- | -- |
| Na | -.796 | .182 | .886 | 0.479 | -- | -- | -- | -- | -- |
| K | -.596 | .037 | .665 | .435 | 0.694 | -- | -- | -- | -- |
| Alk | -.458 | .087 | .591 | .317 | .561 | 0.526 | -- | -- | -- |
| SO4 | -.146 | -.202 | .116 | .129 | .109 | .246 | 0.209 | -- | -- |
| Cl | -.842 | .206 | .901 | .467 | .893 | .673 | .474 | 0.137 | -- |
| Si | -.480 | .035 | .736 | .459 | .730 | .631 | .597 | .129 | 0.632 |
[Trends in units of microequivalents per liter per year, except for discharge in cubic meters per second per year, pH in standard units per year, aluminum, iron, and silica in micromoles per liter per year; <, less than; --, not calculated]
| Parameter |
Unadjusted
|
Flow adjusted
|
||
|
Trend
|
p-value
|
Trend
|
p-value
|
|
| Discharge |
0.011
|
0.751
|
--
|
--
|
| pH, field |
.01
|
.007
|
0.01
|
0.002
|
| Calcium |
-.2
|
.366
|
-.2
|
.434
|
| Magnesium |
<.1
|
.762
|
<.1
|
.645
|
| Sodium |
<.1
|
.532
|
.2
|
.299
|
| Potassium |
<.1
|
.287
|
.1
|
.028
|
|
Alkalinity, laboratory
|
<.1
|
.319
|
1.0
|
.091
|
| Sulfate |
-.5
|
.005
|
-.4
|
.020
|
| Chloride |
.2
|
.569
|
.8
|
.011
|
| Nitrite plus nitrate |
(a)
|
--
|
--
|
--
|
| Silica |
-.5
|
.033
|
.4
|
.051
|
a Insufficient data to calculate trend.
The results of the seasonal Kendall test for trends in discharge and major dissolved constituents are listed in table 12. Statistically significant trends were detected in field pH and unadjusted sulfate concentrations at the 0.01 probability level. Trends were similar for the unadjusted and flow-adjusted field pH, indicating that the pH trend was probably not related to variations in stream discharge. The trend in flow- adjusted sulfate concentrations was not significant at the 0.10 probability level, indicating that the trend in the unadjusted concentrations may have been caused by variations in streamflow. Interpretation of trends in sulfate concentrations at this HBN station, however, is greatly complicated by bias introduced by changes in the analytical technique for sulfate during the period of record. The LOWESS curve in figure 7 shows that the trend in pH primarily was caused by a period of low values in the early 1980's followed by high values near the end of the period of record. The trend in stream-water pH at this station probably was not caused by human activities because the basin is used only for backcountry recreation. Another environmental factor that could affect stream-water chemistry is atmospheric deposition; however, no long-term records of precipitation chemistry are available at this site to confirm such a linkage. A method-related factor is perhaps the most reasonable source of the trend in stream-water pH at this station, particularly considering the rather abrupt decline in pH values in 1980. This pattern may, in part, be explained by changes in electrodes or meters used by field personnel. Some instrument-electrode systems are known to give erroneous readings, particularly when measuring pH in low-conductivity water (Office of Water Quality Technical Memorandum No. 81.08, Electrodes for pH measurement in low- conductivity waters, issued February 10, 1981, at URL http://water.usgs.gov/admin/memo).
Chemical results of the surface-water synoptic sampling of August 1 through 4, 1991, are listed in table 13, and locations of sampling sites are shown in figure 6. During the synoptic sampling, discharge at the HBN station was 2.0 m³/s compared to the median daily discharge of 2.8 m³/s for early August (Lawrence, 1987), indicating that the basin was sampled during normal flow conditions for that time of year. Most of the solute concentrations measured at the HBN station (site 1) during the synoptic sampling were between the first-quartile and median values reported for the station during the entire period of record, except for sulfate, which was slightly lower (table 10). Stream water at the upstream sampling sites was similar in composition to stream water at site 1; calcium and sodium were the predominant cations, and bicarbonate was the predominant anion. Ion balances for all the synoptic samples were positive (range 2.1 to 13 percent), indicating that organic anions may have contributed to the ionic content of stream water during the sampling period.
[Site locations shown in fig. 6; Q, discharge in cubic meters per second; SC, specific conductance in microsiemens per centimeter at 25 degrees Celsius; pH in standard units; Ca, calcium; Mg, magnesium; Na, sodium; K, potassium: Alk, alkalinity; SO4, sulfate; Cl, chloride; NO3, nitrate; Si, silica; concentrations in microequivalents per liter, except silica in micromoles per liter; <, less than; --, not reported]
| Site | Station number | Q | SC | pH | Ca | Mg | Na | K | Alk | S04 | Cl | NO3 | Si | Criteriaa | Remarks |
| 1 | 11264500 |
2.0
|
20
|
7.1 |
90
|
14
|
65
|
7.2
|
--
|
11
|
56
|
2.1
|
70
|
--
|
-- |
| 2 | 374041119340200 |
.022
|
32
|
7.1 |
170
|
38
|
110
|
51
|
300
|
3.1
|
3.7
|
<.7
|
250
|
BG
|
Mafic bedrock |
| 3 | 374113119323500 | .22 | 28 | 7.6 | 140 | 29 | 91 | 12 | 230 | 10 | 25 | <.7 | 180 | BG | Mafic bedrock |
| 4 | 374156119200200 | -- | 7.0 | 6.5 | 31 | 4.8 | 13 | 2.6 | 26 | 10 | 4.8 | 2.9 | 25 | BG | Mafic bedrock |
| 5 | 374237119183900 | .099 | 7.0 | 6.8 | 37 | 8.0 | 17 | 3.6 | 33 | 10 | 1.7 | 7.1 | 32 | BG | Mafic bedrock |
| 6 | 374239119183900 | .027 | 6.0 | 7.0 | 23 | 4.8 | 26 | 3.1 | 38 | 4.2 | 1.4 | <.7 | 83 | BG | Felsic bedrock |
| 7 | 374415119241800 | -- | 18 | 6.9 | 80 | 8.8 | 52 | 4.4 | 59 | 12 | 62 | 2.1 | 37 | MC, LU | Downstream from camprground |
| 8 | 374418119241100 | 1.6 | 19 | 6.6 | 80 | 5.6 | 57 | 7.9 | 65 | 12 | 68 | 2.1 | 37 | MC, LU | Upstream from campground |
| 9 | 374429119255300 | .003 | 9.0 | 6.1 | 44 | 10 | 22 | 4.1 | 51 | 4.0 | 5.9 | 3.6 | 62 | BG | Felsic bedrock |
| 10 | 374603119245500 | -- | 9.0 | 7.1 | 34 | 11 | 39 | 4.1 | -- | 5.8 | 4.2 | <.7 | 85 | BG | Felsic bedrock |
| 11 | 374702119250200 | .014 | 12 | 6.7 | 55 | 8.0 | 52 | 4.4 | 77 | 14 | 4.5 | <.7 | 90 |
BG
|
Felsic bedrock |
a Criteria used in selection of sampling sites: BG = bedrock geology, MC = main channel, LU = land use.
Stream-water chemistry of the synoptic samples collected in the basin varied somewhat in the concentrations of the weathering-derived solutes; for example, alkalinity ranged from 26 to 300 meq/L, and silica ranged 25 to 250 mmol/L (table 13). The highest concentrations of alkalinity and silica were measured at sites 2 and 3 in the Illilouette Creek subbasin. Clow and others (1996) suggested that stream-water concentrations in the Illilouette subbasin were high because the subbasin is covered by a larger percentage of glacial till than other areas of the basin. Variations in the chemistry of the synoptic samples also seem to reflect the spatial distribution of the mapped bedrock geology. For example, streams draining felsic rock types (sites 6, 9, 10, and 11) had lower calcium to sodium ratios than streams draining more mafic rock types (sites 2-5), as would be expected on the basis of the calcium to sodium ratio of plagioclase minerals in these two bedrock types (Clow and others, 1996). Chloride concentrations also varied somewhat spatially; concentrations ranged from more than 50 meq/L in samples collected from the main stem of the river compared to concentrations less than 6 meq/L at most of the upper tributary sites. Surface-water samples collected during several previous studies also had high chloride concentrations along the main stem and low concentrations in most tributaries (Sorenson and Hoffman, 1981). The high chloride concentrations in the river were unexpected, given the low concentrations in precipitation and in common granitic minerals (Feth, 1981). Wastewater-treatment facilities at the campgrounds could be a source of chloride to surface water; however, there was little difference in chloride concentrations in samples collected upstream from (site 8) and downstream from (site 7) the campground at Merced Lake. Clow and others (1996) suggested that the most likely source of chloride was saline ground water from springs that discharge from joints or faults along the valley floor. Sulfate concentrations were low and uniform throughout the basin, which is consistent with the idea that most stream-water sulfate is derived from atmospheric sources and bedrock contributions are negligible. Nitrate concentrations at all of the sampling sites were low, which is consistent with the minimal amount of human activity in the basin and indicates that the backcountry campgrounds had a negligible effect on nutrient concentrations in the river during the synoptic sampling.
Bailey, R.G., Avers, P.E., King, T., McNab, W.H., eds., 1994, Ecoregions and subregions of the United States with supplementary table of map unit descriptions: Washington, D.C., U.S. Department of Agriculture, Forest Service, scale 1:7,500,000.
Barnes, Ivan, 1964, Field measurement of alkalinity and pH: U.S. Geological Survey Water-Supply Paper 1535-H, 17 p.
Bateman, P.C., 1992, Plutonism in the central part of the Sierra Nevada Batholith, California: U.S. Geological Survey Professional Paper 1483, 186 p.
Clow, D.W., Mast, M.A., and Campbell, D.H., 1996, Controls on surface water chemistry in the upper Merced River Basin, Yosemite National Park, California: Hydrological Processes, v. 10, p. 727-746.
Durum, W.H., 1978, Historical profile of quality of water laboratories and activities, 1879-1973: U.S. Geological Survey Open-File Report 78-432, 235 p.
Feth, J.H., 1981, Chloride in natural continental water-A review: Washington, D.C., Government Printing Office, 30 p.
Fishman, M.J., and Friedman, L.C., 1989, Methods for determination of inorganic substances in water and fluvial sediments: U.S. Geological Survey Techniques of Water-Resources Investigations, book 5, chap. A1, 545 p.
Fishman, M.J., Raese, J.W., Gerlitz, C.N., and Husband, R.A., 1994, U.S. Geological Survey approved inorganic and organic methods for the analysis of water and fluvial sediment, 1954-94: U.S. Geological Survey Open-File Report 94-351, 55 p.
Hayes, P.D., Rockwell, G.L., and Anderson, S.W.,1996, Water resources data, California, water year 1995-v. 3, Southern Central Valley Basins andThe Great Basin from Walker River to Truckee River: U.S. Geological Survey Water-Data Report CA-95-3, 508 p.
Huber, N.K., 1987, The geologic story of Yosemite National Park: U.S. Geological Survey, 64 p.
Huntington, G.L., and Akison, M.A., 1987, Pedologic investigations in support of acid rain studies, Sequoia National Park, California-Soil resource inventory of Sequoia National Park, central part: Davis, Department of Land, Air and Water Resources, University of California, 171 p.
Lawrence, C.L., 1987, Streamflow characteristics at hydrologic benchmark stations: U.S. Geological Survey Circular 941, 123 p.
Melack, J.M., and Stoddard, J.L., 1991, Sierra Nevada, California, in Charles, D.F., ed., Acidic deposition and aquatic ecosystems-Regional case studies:New York, Springer-Verlag, p. 503-530.
Rundel, P.W., Parsons, D.J., and Gordon, D.T., 1977, Montane and subalpine vegetation of the Sierra Nevada and Cascade Ranges, in Barbour, M.G., and Major, J., eds., Terrestrial vegetation of California: New York, Wiley, p. 559-599.
Stephenson, N.L., 1988, Climatic control of vegetation distribution-The role of the water balance with examples from North America and Sequoia National Park, California: Ithaca, Cornell University, Ph.D. dissertation.
Sorenson, S.K., and Hoffman, R.J., 1981, Water-quality assessment of the Merced River, California, in the 1977 water year: U.S. Geological Survey Water-Resources Investigation Report 80-75, 37 p.
a. U.S. Geological Survey Topographic Maps:
b. Geologic Maps:
c. Soil Surveys: No soil survey available.
d. Miscellaneous Maps:
Table B-1. NWIS site-identification numbers and site names for water-quality sampling sites.
|
|
|
|
| 1 | 11264500 | MERCED R AT HAPPY ISLES BRIDGE NR YOSEMITE, CA |
| 2 | 374041119340200 | MONO MEADOW TRIB NR YOSEMITE, CA |
| 3 | 374113119323500 | ILLILOUETTE CR NR YOSEMITE, CA |
| 4 | 374156119200200 | UPPER MERCED R NR YOSEMITE, CA |
| 5 | 374237119183900 | HUTCHING CR NR YOSEMITE, CA |
| 6 | 374239119183900 | NORTH FORK LYELL CR NR YOSEMITE, CA |
| 7 | 374415119241800 | MERCED R BELOW HIGH SIERRA CAMP NR YOSEMITE, CA |
| 8 | 374418119241100 | MERCED R ABOVE HIGH SIERRA CAMP NR YOSEMITE, CA |
| 9 | 374429119255300 | CLARK FORK NR YOSEMITE, CA |
| 10 | 374603119245500 | ECHO CR NR YOSEMITE, CA |
| 11 | 374702119250200 | CATHEDRAL FORK NR YOSEMITE, CA |
| Back to 1173-D Contents |
This page maintained by Nichole Bisceglia.
Last updated August 2, 2000.