
Hydrologic Benchmark Network Stations in the Western U.S. 1963-95 (USGS Circular 1173-D)
To download a printer friendly PDF version of this information click here.
This report details one of the approximately 50 stations in the Hydrologic Benchmark Network (HBN) described in the four-volume U.S. Geological Survey Circular 1173. The suggested citation for the information on this page is:
|
Mast, M.A., and Clow, David W., 2000, Environmental characteristics and water-quality of Hydrologic Benchmark Network stations in the Western United States, U.S. Geological Survey Circular 1173-D, 115 p. |
All of the tables and figures are numbered as they appear in each circular. Use the navigation bar above to view the abstract, introduction and methods for the entire circular, as well as a map and list of all of the HBN sites. Use the table of contents below to view the information on this particular station.
|
Table of Contents |
| 1. Site Characteristics and Land Use |
| 2. Historical Water Quality Data and Time-Series Trends |
| 3. Synoptic Water Quality Data |
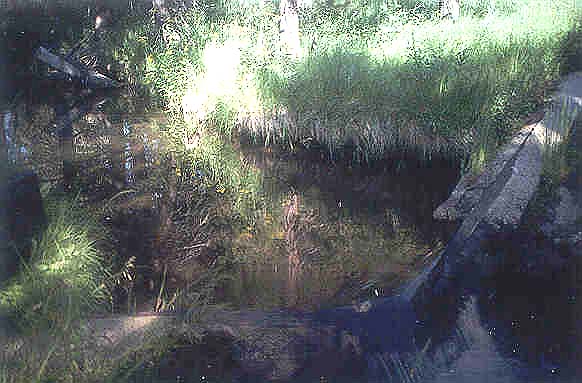
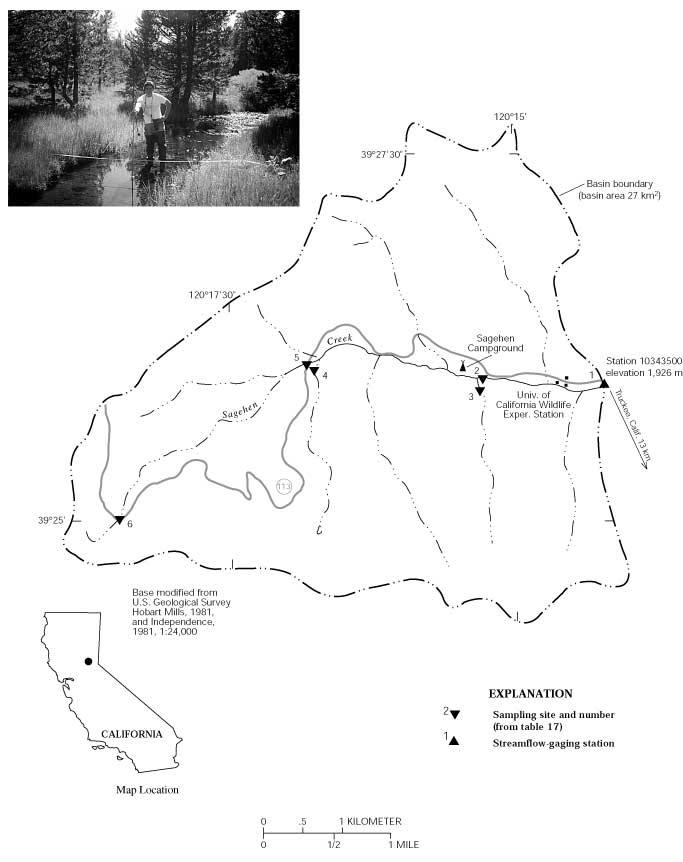
The Sagehen Creek HBN Basin is located on the east slope of the northern Sierra Nevada section of the Sierra-Cascade Mountains physiographic province in central California (Figure 8. Map showing study area of the Sagehen Creek Basin and photograph showing the main channel near the campground ). The basin drains an area of 27 km² and ranges in elevation from 1,926 to 2,663 m. The upper part of the basin is steep, with incised stream channels, and the lower part is a broad, U-
 |
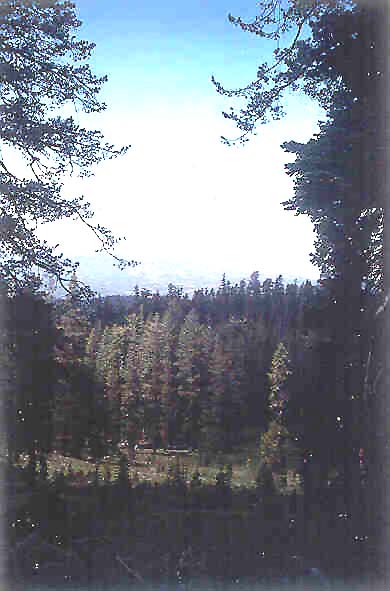
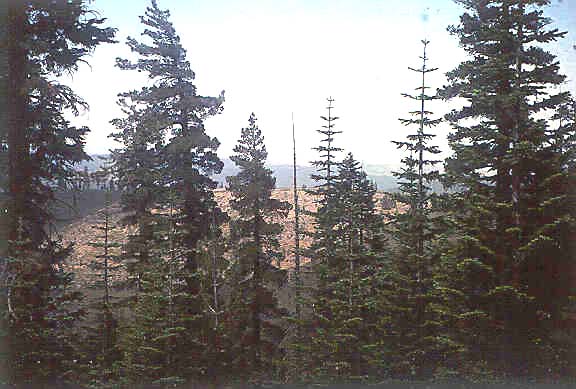
The Sagehen Creek Basin is located within the Sierran Steppe-Mixed Forest-Coniferous Forest-Alpine Meadow Province (Bailey and others, 1994). Vegetation in the basin is dominated by pine and fir forest with grassy meadows along the main channel (Rundel and others, 1977; Andrews and Erman, 1986). The most common trees are Ponderosa pine, Jeffrey pine, Douglas-fir, sugar pine, white fir, red fir, and incense cedar. The basin is about 90 percent forested and 10 percent meadow. Soils are classified as Alfisols and are mapped in the Windy series (Johnson and Needham, 1966). This series consists of deep, well-drained soils developed in material weathered from volcanic rocks that contain up to 90 percent rock fragments. A typical profile has a surface layer of dark grayish brown, gravelly, sandy loam that is 60 cm thick overlying a subsoil of yellowish-brown, cobbly, sandy, loam that extends to a depth of 115 cm. Soils in this series generally are acidic and have base saturation ranges from 2 to 35 percent (Johnson and Needham, 1966).
The oldest rocks in the vicinity of the Sagehen Creek Basin are metamorphic rocks of Triassic-Jurassic age, which crop out west of the basin along the crest of the Sierra Nevada (Lindgren, 1897; Burnett and Jennings, 1962; Birkeland, 1963). The metamorphic rocks, which are mostly banded siliceous hornfels, were intruded by granitic rocks of the Sierra Nevada
 |
The Sagehen Creek Basin is almost entirely in the Tahoe National Forest, except for several hundred hectares that are privately owned by a lumber company. Historical records indicate that low-intensity grazing, logging, and wild fires have occurred in the basin since the late 1800's, and there has been little change in land use since the early 1950's (Erman and others, 1988). The principal human activity in the basin is hydrologic and biological research conducted by a variety of agencies, including the USGS and the University of California. A biological research station operated by the University of California is located about 0.5 km upstream from the HBN station. There are no impoundments or diversions in the basin. Two dirt roads traverse the basin, but access is limited by locked gates. There is an undeveloped campground about 2 km upstream from the HBN station. Other recreational uses include fishing, hiking, skiing, and snowmobiling. There are no mines in the basin, but extensive timber harvesting occurred between the 1880's and the early 1900's. The 10-year projected timber harvest from the basin is 9 to 10 million board feet (D.C. Erman, University of California, written commun., 1998). A sheep allotment of 1,200 units exists for the basin-animals are moved through the basin in August to higher elevations and back to lower elevations in mid-September. The sheep rest and feed 1 to 3 days in each of the large meadows in the basin on the way out (D.C. Erman, written commun., 1998).
The data set for the Sagehen Creek HBN station analyzed for this report includes 43 water-quality samples that were collected from November 1985 through August 1995. During this period of record, samples were collected quarterly and were analyzed at the NWQL in Arvada, Colo. Eleven water-quality samples also were collected at this station between April 1968 and March 1973. Daily discharge records for Sagehen Creek (station 10343500) are available beginning in October 1953. A precipitation gage also was operated at the station from September 1990 to October 1996. Sources of other hydrologic data collected in the basin are compiled in Simpson (1974).
Calculated ion balances for 39 samples that have complete major-ion analyses are shown in figures 9a and 9b. Graphs showing temporal variation of discharge, field pH, major-ion concentrations, and ion balance in Sagehen Creek, California. Ion balances ranged from -8.7 to +14 percent, and almost 85 percent of the samples had values within the ±5 percent range, indicating that the analytical results are of good quality. The average ion balance was 0.5 percent, indicating that unmeasured constituents, such as organic anions, did not seem to contribute substantially to the ionic composition of stream water at this HBN station. Time-series plots of the major dissolved constituents were inspected for evidence of method-related effects (fig. 9). The most notable pattern was in the sulfate concentrations, which decreased considerably in the latter part of the period of record. This pattern probably was caused by a change in the analytical technique for sulfate in 1989 from a turbidimetric technique to ion chromatography (Fishman and others, 1994). An apparent decline in concentrations of nitrite plus nitrate in the 1980's that is most likely an artifact of a decrease in the reporting-limit concentration for this constituent that occurred in 1988 is shown in figure 9.
[Concentrations in units of microequivalents per liter, discharge in cubic meters per second, specific conductance in microsiemens per centimeter at 25 degrees Celsius, pH in standard units, and silica in micromoles per liter; n, number of stream samples; VMW, volume-weighted mean; inst., instantaneous; spec. cond., specific conductance; <, less than; --, not reported]
| Parameter | Stream Water | Precipitation VMAa | |||||
| Minimum | First Quartile | Median | Third Quartile | Maximum | n | ||
| Discarge, inst. | 0.034 | 0.065 | 0.10 | 0.21 | 3.0 | 53 | -- |
| Spec. cond., field | 38 | 79 | 120 | 130 | 150 | 51 | 4.5 |
| pH, field | 6.5 | 7.7 | 7.9 | 8.1 | 8.3 | 51 | 5.4b |
| Calcium | 4.0 | 460 | 600 | 690 | 800 | 54 | 2.3 |
| Magnesium | 0.8 | 240 | 360 | 390 | 650 | 54 | 1.2 |
| Sodium | 5.2 | 160 | 240 | 260 | 320 | 54 | 3.8 |
| Potassium | .3 | 28 | 47 | 59 | 84 | 52 | .3 |
| Ammonium | <.1 | .4 | .6 | 1.1 | 28 | 45 | 7.5 |
| Alkalinity, laboratory | 440 | 900 | 1,220 | 1,370 | 1,600 | 51 | -- |
| Sulfate | <2.1 | 2.1 | 21 | 22 | 130 | 52 | 5.9 |
| Chloride | <2.8 | 8.5 | 11 | 17 | 56 | 51 | 4.1 |
| Nitrite plus nitrate | .4 | .9 | 2.0 | 4.4 | 21 | 45 | 7.7c |
| Silica | 140 | 430 | 480 | 530 | 580 | 53 | -- |
a Values are volume-weighted mean concentrations for 1982-95.
b Laboratory pH.
c Nitrate only.
The median concentrations and ranges of major dissolved constituents in stream water collected at the HBN station and VWM concentrations in wet-only precipitation measured at the Yosemite National Park NADP station are presented in table 14. Precipitation chemistry at the NADP station, which is about 185 km southeast of the HBN station, is very dilute and
|
Stream water in Sagehen Creek is moderately concentrated and well buffered; specific conductance ranged from 38 to 150 mS/cm, and alkalinity ranged from 440 to 1,600 meq/L (table 14). The major cations in stream water were calcium and magnesium, and the major anion was bicarbonate. The predominance of these solutes in stream water is attributed to the weathering of plagioclase minerals in the volcanic bedrock. The median chloride concentrations in stream water was 11 meq/L compared to the VWM concentration of 4.1 in precipitation. Based on the difference between annual precipitation and runoff, evapotranspiration can account for about a twofold increase in the chloride concentration in precipitation, indicating that most stream-water chloride is probably derived from atmospheric deposition. The median concentration of sulfate in stream water was 21 meq/L, which was 3.6 times greater than the VWM concentrations of 5.9 meq/L in precipitation, indicating that wet deposition alone cannot account for the sulfate concentrations in stream water. Because inputs of sulfate from dry deposition and bedrock weathering should be negligible (Melack and Stoddard, 1991), the most plausible explanation for the higher stream-water sulfate concentrations is a positive bias introduced by the analytical technique used prior to 1991 (fig. 9). Concentrations of inorganic nitrogen species in stream water generally were less than the VWM concentrations in precipitation, indicating that most atmospheric nitrogen is retained by vegetation and soils and that livestock grazing in the basin does not seem to substantially affect nutrient concentrations at the HBN station.
[Q, discharge; Ca, calcium, Mg, magnesium; Na, sodium; K, potassium; Alk, alkalinity; SO4, sulfate; Cl, chloride; N, nitrite plus nitrate; Si, silica]
|
|
|
|
|
|
|
|
|
|
|
|
| pH | -0.671 | -- | -- | -- | -- | -- | -- | -- | -- | -- |
| Ca | -.873 | 0.618 | -- | -- | -- | -- | -- | -- | -- | -- |
| Mg | -.847 | .549 | 0.947 | -- | -- | -- | -- | -- | -- | -- |
| Na | -.919 | .616 | .934 | 0.946 | -- | -- | -- | -- | -- | -- |
| K | -.915 | .544 | .938 | .957 | 0.969 | -- | -- | -- | -- | -- |
| Alk | -.889 | .554 | .909 | .912 | .920 | 0.920 | -- | -- | -- | -- |
| SO4 | .070 | -.114 | .171 | .261 | .159 | .120 | 0.131 | -- | -- | -- |
| Cl | -.098 | -.088 | .108 | .076 | .125 | .114 | .150 | 0.022 | -- | -- |
| N | -.062 | -.034 | .235 | .237 | .193 | .168 | .215 | .683 | 0.223 | -- |
| Si | -.867 | .576 | .893 | .923 | .928 | .923 | .889 | .231 | .133 | 0.266 |
[Trends in units of microequivalents per liter per year, except for discharge in cubic meters per second per year, pH in standard units per year, and silica in micromoles per liter per year; <, less than; --, not calculated]
| Parameter |
Unadjusted
|
Flow adjusted
|
||
|
Trend
|
p-value
|
Trend
|
p-value
|
|
| Discharge |
-0.005
|
0.042
|
--
|
--
|
| pH, field |
<.01
|
.439
|
0.01
|
0.405
|
| Calcium |
<.1
|
.213
|
-12.5
|
.000
|
| Magnesium |
-5.4
|
.015
|
-8.6
|
.000
|
| Sodium |
-2.2
|
.378
|
-4.4
|
.000
|
| Potassium |
-.9
|
.278
|
-1.2
|
.000
|
|
Alkalinity, laboratory
|
-11.2
|
.426
|
-22.0
|
.000
|
| Sulfate |
-3.3a
|
.000
|
--
|
--
|
| Chloride |
-.4
|
.255
|
(b)
|
--
|
| Nitrite plus nitrate |
<-.1a
|
.001
|
--
|
--
|
| Silica |
-5.4
|
.014
|
-5.8
|
.000
|
a Trend calculated using a trend test for censored data.
b Flow model not significant at a = 0.10.
The solute composition of stream water was further evaluated by analyzing correlations between solutes and stream discharge (table 15). Most weathering-derived solutes had strong inverse correlations with stream discharge, particularly sodium (rho = -0.919), potassium (rho = -0.915), and alkalinity (rho = -0.889). These results are consistent with a hydrologic system where weathering-enriched base flow is diluted by water from shallow or surficial sources during periods of increased discharge, particularly spring snowmelt. For the solutes, strong positive correlations existed among the base cations, alkalinity, and silica
 |
The results of the seasonal Kendall test for trends in discharge and major dissolved constituents are listed in table 16. Statistically significant trends were detected in unadjusted sulfate and nitrite plus nitrate concentrations at the 0.01 probability level. After the concentrations were corrected for flow, statistically significant trends also were detected in calcium, magnesium, sodium, potassium, and silica concentrations at the 0.01 probability level. The LOWESS curves in figure 9 show that the trends in sulfate and nitrite plus nitrate were probably caused by method-related factors rather than by environmental change. For example, the abrupt decline in sulfate concentrations is coincident with a change in the analytical technique for sulfate and a decrease in the analytical reporting limit beginning in 1991. Similarly, the apparent decline in nitrite plus nitrate concentrations was primarily caused by a decrease in the analytical reporting limit beginning in 1988. The cause of the downward trends in the base cation and alkalinity concentrations could not be identified; however, the fact that these trends were detected only in the flow-adjusted concentrations indicates that they were probably caused by environmental change rather than by a method-related factor. Considering the dilute chemistry of precipitation at the Yosemite NADP station compared to the stream (table 14), changes in atmospheric deposition probably could not account for the trends in stream-water chemistry. Similarly, changes in land use probably were not an important factor because the basin is used only for scientific research and a limited amount of grazing. Perhaps the most plausible explanation for the trends in water quality is climate variability. Although a detailed analysis of climate effects is beyond the scope of this report, long-term precipitation records in the area (National Climatic Data Center at http://www.ncdc.noaa.gov), as well as daily discharge records for Sagehen Creek (Hayes and others, 1996), indicated that there was an extended period of drought that persisted in the region from 1987 through 1994.
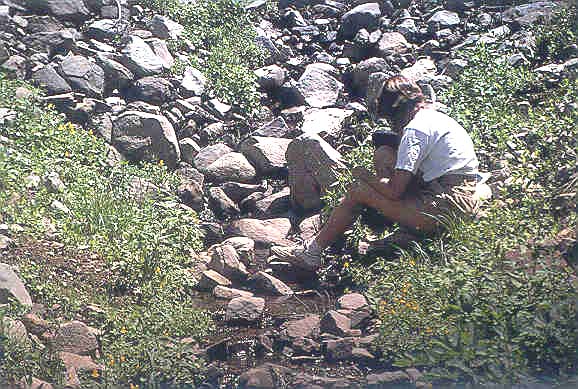
Chemical results of the surface-water synoptic sampling on July 27, 1991, are listed in table 17, and locations of sampling sites are shown in figure 8. During the synoptic sampling, discharge at the HBN station was 0.06 m³/s compared to the mean daily discharge of 0.21 m³/s and 0.09 m³/s for July and August, indicating that the basin was sampled during low flow conditions for that time of year. Most of the solute concentrations measured at the HBN station (site 1) during the synoptic sampling were above the third-quartile values reported for the station during the entire period of record, except for the sulfate and chloride concentrations, which were lower than the first-quartile concentrations (table 14). Stream water at the upstream sampling sites was similar in composition to stream water at site 1, with calcium the predominant cation and bicarbonate the predominant anion. Ion balances for the synoptic samples ranged from -0.3 to 3.6 percent and averaged 2.0 percent, indicating that unmeasured constituents, such as organic anions, may have contributed slightly to the ionic content of stream water during the sampling period. The results presented in table 17 had relatively little variation among the sampling sites in the concentrations of the weathering-derived solutes. For example, calcium ranged from 300 to 800 meq/L, alkalinity ranged from 540 to 1,620 meq/L, and silica ranged from 350 to 620 mmol/L. This similarity in stream chemistry reflects the relatively small size of the basin and the uniform composition of the underlying geology. The one spatial pattern that is apparent is a progressive increase in concentrations in samples collected along the main channel of Sagehen Creek between the headwaters (site 6) and the HBN station (site 1), which probably reflects increasing inputs of ground water with decreasing elevation along the channel. Chloride and sulfate concentrations were low and uniform among the sampling sites, supporting the idea that these solutes primarily are derived from atmospheric sources, and that basin sources are minor. Nitrate concentrations at all of the sampling sites were less than the analytical reporting limit of 3.6 meq/L, which is consistent with the minimal amount of land use in the basin.
[Site locations shown in fig. 8; Q, discharge in cubic meters per second; SC, specific conductance in microsiemens per centimeter at 25 degrees Celsius; pH in standard units; Ca, calcium; Mg, magnesium; Na, sodium; K, potassium; Alk, alkalinity; SO4, sulfate; Cl, chloride; NO3, nitrate: Si, silica; concentrations in microequivalents per liter, except silica in micromoles per liter; <, less than; --, not reported]
| Site | Station number | Q | SC | pH | Ca | Mg | Na | K | Alk | S04 | Cl | NO3 | Si | Criteriaa | Remarks |
| 1 | 10343500 |
0.056
|
140
|
8.0 |
750
|
440
|
280
|
62
|
1,420
|
2.1
|
<2.8
|
<3.6
|
530
|
MC
|
-- |
| 2 | 392558120152100 |
.017
|
120
|
8.0 |
650
|
380
|
240
|
44
|
1,320
|
2.1
|
<2.8
|
<3.6
|
470
|
MC
|
Downstream from campground |
| 3 | 392558120152000 | -- | 170 | 7.5 | 800 | 400 | 404 | 87 | 1,620 | 4.2 | 11 |
<3.6
|
550 | T, BG | Pyroclastic rocks |
| 4 | 392602120164500 | -- | 140 | 8.1 | 650 | 420 | 240 | 67 | 1,280 | 2.1 | 11 |
<3.6
|
620 | T, BG | Pyroclastic rocks |
| 5 | 392604120164900 | .0062 | 80 | 7.9 | 460 | 220 | 140 | 20 | 800 | .8 | 4.5 | 1.4 | 430 | MC, BG | Morainal cover |
| 6 | 392501120182800 | .00003 | 55 | 7.4 | 300 | 150 | 100 | 13 | 540 | 2.7 | 4.2 |
<0.7
|
350 | MC, BG | Pyroclastic rocks, headwaters |
a Criteria used in selection of sampling sites: BG = bedrock geology, MC = main channel, T = tributary.
Andrews, E.D., and Erman, D.C., 1986, Persistence in the size distribution of surficial bed material during an extreme snowmelt flood: Water Resources Research, v. 22, no. 2, p. 191-197.
Bailey, R.G., Avers, P.E., King, T., McNab, W.H., eds., 1994, Ecoregions and subregions of the United States with supplementary table of map unit descriptions: Washington, D.C., U.S. Department of Agriculture, Forest Service, scale 1:7,500,000.
Bateman, P.C., 1992, Plutonism in the central part of the Sierra Nevada Batholith, California: U.S. Geological Survey Professional Paper 1483, 186 p.
Birkeland, P.W., 1963, Pleistocene volcanism and deformation of the Truckee area, north of Lake Tahoe, California: Geological Society of America Bulletin, v. 74, no. 12, p. 1453-1463.
Burnett, J.L., and Jennings, C.W., 1962, Geologic map of California, Chico sheet: Sacramento, California, Department of Natural Resources, Division of Mines and Geology, scale 1:250,000.
Erman, D.C., Andrews, E.D., and Yoder-Williams, M.P., 1988, Effects of winter floods on fishes in the Sierra Nevada: Canadian Journal of Fisheries and Aquatic Sciences, v. 45, no. 12, p. 2195-2200.
Fishman, M.J., Raese, J.W., Gerlitz, C.N., and Husband, R.A., 1994, U.S. Geological Survey approved inorganic and organic methods for the analysis of water and fluvial sediment, 1954-94: U.S. Geological Survey Open-File Report 94-351, 55 p.
Hayes, P.D., Rockwell, G.L., and Anderson, S.W.,1996, Water resources data, California, water year 1995-v. 3, Southern Central Valley Basins and The Great Basin from Walker River to Truckee River: U.S. Geological Survey Water-Data Report CA-95-3, 508 p.
Hudson, F.S., 1951, Mount Lincoln-Castle Peak area, Sierra Nevada, California: Geological Society of America Bulletin, v. 62, p. 931-952.
Johnson, C.M., and Needham, P.R., 1966, Ionic composition of Sagehen Creek, California, following an adjacent fire: Ecology, v. 47, no. 4, p. 636-639.
Lindgren, Waldemar, 1897, Description of the Truckee quadrangle, California: U.S. Geological Survey Geological Atlas Folio 39, scale 1:125,000.
Melack, J.M., and Stoddard, J.L., 1991, Sierra Nevada, California, in Charles, D.F., ed., Acidic deposition and aquatic ecosystems-Regional case studies:New York, Springer-Verlag, p. 503-530.
Richmond, G.M., and Fullerton, D.S., 1986, Summation of Quaternary glaciations in the United States of America: Quaternary Science Review, v. 5, p. 183-196.
Rundel, P.W., Parsons, D.J., and Gordon, D.T., 1977, Montane and subalpine vegetation of the Sierra Nevada and Cascade Ranges, in Barbour, M.G., and Major, J., eds., Terrestrial vegetation of California: New York, Wiley, p. 559-599.
Simpson, R.G., 1974, Selected hydrologic data, Sagehen Creek Basin near Truckee, California, 1954-1972: U.S. Geological Survey, U.S. Geological Survey Water-Resources Investigations Report 55-73, 50 p.
a. U.S. Geological Survey Topographic Maps:
b. Geologic Maps:
c. Soil Surveys:
d. Miscellaneous Maps:
Table B-1. NWIS site-identification numbers and site names for water-quality sampling sites.
|
|
|
|
| 1 | 10343500 | SAGEHEN CR NR TRUCKEE, CA |
| 2 | 392558120152100 | SAGEHEN CR AB CAMPGROUND NR HOBART MILLS, CA |
| 3 | 392558120152000 | PRE-CAMPGROUND TRIB NR HOBART MILLS, CA |
| 4 | 392602120164500 | SAGEHEN HILLS TRIB NR HOBART MILLS, CA |
| 5 | 392604120164900 | SAGEHEN CR BLW LOGGED AREA NR HOBART MILLS, CA |
| 6 | 392501120182800 | SAGEHEN CR NR CARPENTER RIDGE, CA |
| Back to 1173-D Contents |
This page maintained by Nichole Bisceglia.
Last updated August 2, 2000.