
Hydrologic Benchmark Network Stations in the Western U.S. 1963-95 (USGS Circular 1173-D)
To download a printer friendly PDF version of this information click here.
This report details one of the approximately 50 stations in the Hydrologic Benchmark Network (HBN) described in the four-volume U.S. Geological Survey Circular 1173. The suggested citation for the information on this page is:
|
Mast, M.A., and Clow, David W., 2000, Environmental characteristics and water-quality of Hydrologic Benchmark Network stations in the Western United States, U.S. Geological Survey Circular 1173-D, 115 p. |
All of the tables and figures are numbered as they appear in each circular. Use the navigation bar above to view the abstract, introduction and methods for the entire circular, as well as a map and list of all of the HBN sites. Use the table of contents below to view the information on this particular station.
|
Table of Contents |
| 1. Site Characteristics and Land Use |
| 2. Historical Water Quality Data and Time-Series Trends |
| 3. Synoptic Water Quality Data |
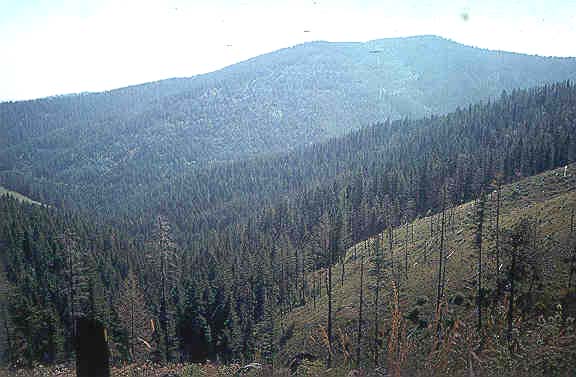
The Hayden Creek HBN Basin is in the northern Idaho panhandle and is part of the Northern Rocky Mountains physiographic province of the Rocky Mountain System (Figure 12. Map showing the study area in the Hayden Creek Basin and photograph showing the basin landscape). The basin drains 57 km² of steep, mountainous terrain that ranges in elevation from 722 m at the HBN station to 1,707 m at the summit of South Chilco Mountain. The HBN station is 12 km northeast of the Hayden Lake Post Office, at latitude 47°49'22'' and longitude 116°39'10''. Hayden Creek flows west into the northern inlet of Hayden Lake, which drains towards the Spokane River, and has a channel length of 11 km and an average stream gradient of 61 m/km. The main channel is perennial, and mean monthly discharge ranges from 0.14 m³/s during low-flow conditions in September to 2.25 m³/s in April, during spring snowmelt. Average annual runoff from the basin was 44 cm from
 |
The Hayden Creek HBN Basin is in the montane zone of the Northern Rocky Mountain Forest- Steppe-Coniferous Forest-Alpine Meadow ecoregion (Bailey and others, 1994). Aspect and elevation control species distribution of trees. Ponderosa pine, Douglas-fir, and grand fir tend to grow in relatively hot, dry sites, and western hemlock, western red cedar, and spruce prefer cool, wet areas. Mature forests historically were primarily Ponderosa pine, western larch, and western white pine. During the early part of the 20th century, most of the mature forests were logged, and Douglas-fir and grand fir are the predominant trees in the second-growth forests. These trees are affected by root rot and bark beetle infestations, resulting in extensive patches of diseased and dying trees in the second- growth forest. Application of pesticides by air helped control pest infestations until the 1980's, when spraying was discontinued because of environmental concerns. Understory vegetation includes pachistema, clintonia, galium, and ceanothus (U.S. Department of Agriculture, 1987a).
Soils in the basin are Inceptisols developed on alluvium and colluvium derived from the local metasedimentary bedrock. Loess, derived mostly from volcanic dust blown east from the volcanoes in the Cascade Range in Washington and Oregon, is an important component of the upper soil horizons. Soils are part of the Huckleberry-McCrosket-Ardenvoir series, which is described as sloping to very steep, moderately deep to deep soils that formed in volcanic ash and loess over metasedimentary rock (Weisel, 1981). A typical soil profile includes a gravelly silt loam surface layer and a gravelly loam subsoil and
 |
The Hayden Creek HBN Basin is in Kootenai County in Idaho and is entirely within the boundaries of the Coeur d'Alene National Forest. The basin is accessible by a network of unpaved roads that parallel most of the main drainages. Roads are not plowed or salted in winter, but they are treated with magnesium chloride during summer to control dust (Jeffery Johnson, U.S. Department of Agriculture Forest Service, oral commun., 1998). The lower part of the basin is in a management category designated for timber production and recreation (U.S. Department of Agriculture, 1987b). Timber production and recreation must be conducted so that they maintain or enhance big game habitat. In the upper part of the basin, timber harvesting and production are the primary management priorities. During the past 10 years, timber harvesting has averaged about 0.5 to 1 million board feet per year. Much of the timber harvesting involves removal of dead or damaged trees. A small grazing allotment of 18 cows and calves is allowed in the basin, but no sheep allotment exists for the basin. Two small mining prospects exist in the northern part of the basin, but there has been no recent mining activity (Jeffery Johnson, oral commun., 1998). Tailings piles at the two prospects are small, although one extends into a stream channel. Surface-water drainage from the prospect pits is insignificant, except perhaps during snowmelt. Recreational use in the basin includes dispersed (unimproved) campsites. In the early 1990's, the Forest Service instituted a policy of a 14-day limit on camping at a given site. This discouraged squatters who had been using areas in the basin as homesteads.
The data set for the Hayden Creek HBN station analyzed for this report includes 164 water-quality samples that were collected from November 1966 through September 1995. Sampling frequency ranged from 6 to 11 times per year from 1967 to 1982, then was decreased to quarterly from 1983 to 1995. Samples from the early part of the period of record were
 |
Calculated ion balances for 150 samples that have complete major-ion analyses are shown in figures 13a and 13b. Graphs showing temporal variation of discharge, field pH, major-ion concentrations, and ion balance in Hayden Creek, Idaho. Ion balances ranged from -33 to +31 percent, and 85 percent of the samples had values within the ±10-percent range, indicating that the analytical results are of good quality. The average ion balance was -0.5 percent, indicating that unmeasured constituents, such as organic anions, generally do not contribute significantly to the ionic composition of stream water at this HBN station. Time-series plots of the major dissolved constituents were inspected for evidence of method-related effects (fig. 13). The most notable patterns are a downward shift in field pH in 1970 and a decline in sulfate concentrations near the end of the period of record. The abrupt nature of the shift in pH values indicates that the measurements may have been biased by changes in field procedures or instrumentation (Schertz and others, 1994). Although natural variations in sulfate concentrations cannot be completely ruled out, the low sulfate concentrations in the 1990's were probably caused by a change in the analytical technique for sulfate from a turbidimetric technique to ion chromatography in 1990 (Fishman and others, 1994). A period of elevated and uniform sulfate concentrations in 1982 and 1983 that is shown in figure 13 was caused by an increase in the analytical reporting limit for sulfate to 5 mg/L (104 meq/L) during those 2 years. The stepped pattern in concentrations of nitrite plus nitrate and chloride at this station also was caused by changes in the analytical reporting limits for these constituents.
[Concentrations in units of microequivalents per liter, discharge in cubic meters per second, specific conductance in microsiemens per centimeter at 25 degrees Celsius, pH in standard units, and silica in micromoles per liter; n, number of stream samples; VMW, volume-weighted mean; inst., instantaneous; spec. cond., specific conductance; <, less than; --, not reported]
| Parameter | Stream Water | Precipitation VMAa | |||||
| Minimum | First Quartile | Median | Third Quartile | Maximum | n | ||
| Discarge, inst. | 0.065 | 0.15 | 0.29 | 1.00 | 7.9 | 164 | -- |
| Spec. cond., field | 35 | 53 | 68 | 78 | 90 | 161 | 3.7 |
| pH, field | 5.8 | 7.0 | 7.4 | 7.6 | 8.4 | 159 | 5.4b |
| Calcium | 200 | 330 | 430 | 500 | 650 | 164 | 3.6 |
| Magnesium | 120 | 170 | 220 | 260 | 330 | 164 | 1.1 |
| Sodium | 13 | 57 | 61 | 70 | 100 | 162 | 2.6 |
| Potassium | 2.6 | 13 | 15 | 18 | 74 | 163 | .5 |
| Ammonium | <.7 | .7 | 1.4 | 4.3 | 18 | 70 | 3.5 |
| Alkalinity, laboratory | 240 | 500 | 620 | 780 | 1,160 | 159 | -- |
| Sulfate | 4.2 | 42 | 58 | 75 | 130 | 160 | 5.8 |
| Chloride | <2.8 | 8.5 | 14 | 19 | 59 | 162 | 2.4 |
| Nitrite plus nitrate | <.7 | 2.1 | 5.4 | 7.1 | 33 | 128 | 5.1c |
| Silica | 20 | 200 | 220 | 220 | 420 | 161 | -- |
a Values are volume-weighted mean concentrations for 1982-91.
b Laboratory pH.
c Nitrate only.
The median concentrations and ranges of major dissolved constituents in stream water collected at the HBN station and VWM concentrations in wet-only precipitation measured at the Headwaters NADP station are presented in table 22. Precipitation chemistry at the NADP station, which is about 150 km southeast of the HBN station, is dilute and slightly acidic and has a VWM pH of 5.4 for 10 years of record. The predominant cations in precipitation were hydrogen, calcium, and ammonium, which contributed 26, 24, and 23 percent of the total cation charge, respectively. The predominant anions were sulfate and nitrate, which accounted for 43 and 38 percent of the total anion charge, respectively. The predominance of strong acid anions may indicate that precipitation at the NADP station is affected by industrial emissions of sulfur and nitrogen compounds that cause acid rain.
Stream water in Hayden Creek is moderately concentrated and well buffered; specific conductance ranged from 35 to 90 mS/cm and alkalinity ranged from 240 to 1,160 meq/L (table 22). The major cations in stream water were calcium and magnesium, and the major anion was bicarbonate. The predominance of these solutes in stream water is attributed to the weathering of limestone and dolomite units in the underlying metasedimentary bedrock. The median chloride concentration of stream water was 14 meq/L compared to the VWM concentrations of 2.4 meq/L in precipitation. Based on the difference
 |
The solute composition of stream water was further evaluated by analyzing correlations between solutes and stream discharge (table 23). Most weathering-derived solutes had strong inverse correlations with stream discharge, particularly calcium (rho = -0.851), magnesium (rho = -0.893) and alkalinity (rho = -0.841). These results are consistent with a hydrologic system where weathering-enriched base flow is diluted by water from shallow or surficial sources during periods of increased discharge, particularly spring snowmelt. For the solutes, the strongest correlations were found among calcium, magnesium, and alkalinity, which is consistent with the weathering of carbonate minerals. Chloride was weakly correlated with the weathering-derived constituents, which is consistent with the idea that chloride is derived from sources other than weathering. The poor correlations between sulfate and the weathering-derived solutes was unexpected because most sulfate is probably derived from the bedrock.
[Q, discharge; Ca, calcium; Mg, magnesium; Na, sodium; K, potassium; Alk, alkalinity; SO4, sulfate; Cl, chloride; Si, silica]
|
|
|
|
|
|
|
|
|
|
|
| pH | -0.283 | -- | -- | -- | -- | -- | -- | -- | -- |
| Ca | -.851 | 0.231 | -- | -- | -- | -- | -- | -- | -- |
| Mg | -.893 | .300 | 0.883 | -- | -- | -- | -- | -- | -- |
| Na | -.619 | .288 | .590 | 0.595 | -- | -- | -- | -- | -- |
| K | -.099 | .235 | .210 | .140 | 0.282 | -- | -- | -- | -- |
| Alk | -.841 | .392 | .852 | .865 | .600 | 0.236 | -- | -- | -- |
| SO4 | -.270 | .039 | .267 | .288 | .092 | .150 | 0.220 | -- | -- |
| Cl | -.053 | -.006 | .065 | .020 | .042 | .158 | -.034 | 0.217 | -- |
| Si | .249 | .021 | -.142 | -.238 | .060 | .201 | -.100 | -.111 | -0.113 |
[Trends in units of microequivalents per liter per year, except for discharge in cubic meters per second per year, pH in standard units per year, and silica in micromoles per liter per year; <, less than; --, not calculated]
| Parameter |
Unadjusted
|
Flow adjusted
|
||
|
Trend
|
p-value
|
Trend
|
p-value
|
|
| Discharge |
-0.001
|
0.707
|
--
|
--
|
| pH, field |
.02
|
.000
|
0.02
|
0.000
|
| Calcium |
<.1
|
.640
|
.2
|
.658
|
| Magnesium |
<.1
|
.874
|
.1
|
.643
|
| Sodium |
<.1
|
.111
|
.1
|
.096
|
| Potassium |
<.1
|
.023
|
(a)
|
--
|
|
Alkalinity, laboratory
|
<.1
|
.468
|
.7
|
.265
|
| Sulfate |
-.3
|
.073
|
-.4
|
.038
|
| Chloride |
<.1
|
.356
|
(a)
|
--
|
| Nitrite plus nitrate |
(b)
|
--
|
--
|
--
|
| Silica |
<.1
|
.104
|
(a)
|
--
|
a Flow model not significant at a = 0.10.
b Insufficient data to calculate trend.
The results of the seasonal Kendall test for trends in discharge and major dissolved constituents are listed in table 24. An increase in field pH was the only statistically significant trend detected at the 0.01 probability level. The trend in pH was similar for the unadjusted and flow-adjusted values, indicating that the trend was not related to variations in stream discharge. The LOWESS curve in figure 13 shows that field pH dropped abruptly in 1970 then increased gradually until leveling off in the late 1980's. The trend in stream-water pH at this HBN station probably was not related to a change in atmospheric deposition, considering the dilute chemistry of precipitation at the NADP station compared to the chemistry of the stream (table 22). Other environmental factors that may have caused changes in stream-water chemistry include changes in logging and grazing activities. However, a change in land use probably would not have affected stream-water pH without affecting the concentrations of other solutes as well. A method-related factor is perhaps the most reasonable cause of the trend in stream-water pH, particularly considering the rather abrupt decrease in pH values in 1970. This pattern may have been caused by a change in electrodes or meters used by field personnel. Some instrument-electrode systems are known to produce erroneous readings, particularly when measuring pH in low- conductivity water (Office of Water Quality Technical Memorandum No. 81.08, Electrodes for pH measurement in low-conductivity waters, issued February 10, 1981, at URL http://water.usgs.gov/admin/memo).
Results of the surface-water synoptic sampling of August 4 and 5, 1992, are presented in table 25, and locations of sampling sites are shown in figure 12. During the synoptic sampling, discharge at the HBN station was 0.10 m³/s compared to the median daily discharge of 0.25 for July and 0.15 m³/s for August (Lawrence, 1987), indicating that the basin was sampled under slightly lower than normal flow conditions for that time of year. Most of the solute concentrations measured at the HBN station (site 1) during the synoptic sampling were close to the third-quartile values reported for the station during the entire period of record, except for sulfate and chloride concentrations, which were close to the first-quartile values (table 22). Stream water collected at the tributary streams was similar in composition to stream water at site 1, with calcium the major cation and bicarbonate the major anion. Ion balances for all the synoptic samples were negative (ranging from -2.7 to -7.5 percent), perhaps indicating a bias in the analytical measurements. Concentrations of the weathering-derived solutes in the synoptic samples varied somewhat in the basin. For example, calcium ranged from 95 to 1,400 meq/L, magnesium ranged from 30 to 340 meq/L, and alkalinity ranged from 240 to 1,760 meq/L (table 25). Variations in base-cation and alkalinity concentrations do not seem to be related to differences in elevation or sub-basin size. For example, the lowest concentrations were measured at site 6, which is similar in size and elevation to site 8, which had the highest concentrations. Differences in solute concentrations may reflect the distribution of different rock types in the basin; however, a detailed geologic map is not available to confirm such a relation. Sulfate concentrations ranged from 18 to 54 meq/L and followed a pattern similar to the other weathering-derived solutes, indicating that sulfate concentrations also may reflect local variations in geology. Chloride concentrations varied some-what, ranging from <0.3 meq/L at site 2 to 42 meq/L at site 4. The two highest chloride concentrations were measured in streams (sites 3 and 4) draining areas that had recent logging activity. The slightly higher chloride concentrations may be due to application of magnesium chloride to roads in this subbasin to control dust from logging traffic. Nitrite plus nitrate concentrations were low at all sampling sites, indicating that land use in the basin did not have a substantial effect on nitrate concentrations in the streams during the sampling period.
[Site locations shown in fig. 12; Q, discharge in cubic meters per second; SC, specific conductance in microsiemens per centimeter at 25 degrees Celsius; pH in standard units; Ca, calcium; Mg, magnesium; Na, sodium; K, potassium: Alk, alkalinity; SO4, sulfate; Cl, chloride; NO3, nitrate; Si, silica; concentrations in microequivalents per liter, except silica in micromoles per liter; <, less than; --, not reported]
| Site | Station number | Q | SC | pH | Ca | Mg | Na | K | Alk | S04 | Cl | NO3 | Si | Criteriaa | Remarks |
| 1 | 12416000 |
0.10
|
86
|
7.9 |
500
|
250
|
74
|
17
|
860
|
48
|
7.9
|
1.1
|
220
|
--
|
-- |
| 2 | 474924116360600 |
.010
|
110
|
8.1 |
650
|
340
|
78
|
17
|
1,100
|
46
|
<.3
|
3.1
|
220
|
MT, LU
|
Few roads |
| 3 | 474930116384600 | .067 | 86 | 7.8 | 500 | 240 | 70 | 16 | 900 | 33 | 25 |
1.6
|
220 |
MT, LU
|
Recent logging |
| 4 | 474933116361200 | .033 | 73 | 7.8 | 420 | 200 | 65 | 11 | 720 | 23 | 42 |
2.2
|
200 |
MT, LU
|
Recent logging |
| 5 | 474942116385700 | .036 | 82 | 7.8 | 500 | 250 | 74 | 19 | 900 | 48 | 15 | 1.2 | 220 |
MT, LU
|
Downstream from Bradbury Mine |
| 6 | 475150116335500 | .014 | 21 | 7.3 | 95 | 30 | 48 | 7.9 | 240 | 18 | 11 | 5.7 | 170 |
HT, LU
|
Few roads |
| 7 | 475153116380900 | -- | 98 | 7.8 | 700 | 150 | 78 | 31 | 960 | 50 | 9.0 | 10 | 270 |
HT, LU
|
Few roads |
| 8 | 475204116365000 | .00028 | 180 | 8.0 | 1,400 | 240 | 74 | 44 | 1,760 | 54 | 11 | 1.5 | 250 |
HT, LU
|
Few roads |
Bailey, R.G., Avers, P.E., King, T., McNab, W.H., eds., 1994, Ecoregions and subregions of the United States with supplementary table of map unit descriptions: Washington, D.C., U.S. Department of Agriculture, Forest Service, scale 1:7,500,000.
Brennan, T.S., O'Dell, I., Lehmann, A.K., and Tungate, A.M., 1996, Water resources data, Idaho, water year 1995- v. 2, Upper Columbia River Basin and Snake River Basin below King Hill: U.S. Geological Survey Water-Data Report ID-95-2, 357 p.
Durum, W.H., 1978, Historical profile of quality of water laboratories and activities, 1879-1973: U.S. Geological Survey Open-File Report 78-432, 235 p.
Fishman, M.J., Raese, J.W., Gerlitz, C.N., and Husband, R.A., 1994, U.S. Geological Survey approved inorganic and organic methods for the analysis of water and fluvial sediment, 1954-94: U.S. Geological Survey Open-File Report 94-351, 55 p.
Gribbs, A.B., 1973, Geologic map of the Spokane quadrangle, Washington, Idaho, and Montana: U.S. Geological Survey Miscellaneous Geologic Investigations Map I-768, scale 1:250,000.
Kuennen, L.J., and Nielsen-Gerhardt, M.L., 1995, Soil survey of Kootenai National Forest area, Montana and Idaho: Washington D.C., U.S. Department of Agriculture Forest Service, 118 p.
Lawrence, C.L., 1987, Streamflow characteristics at hydrologic benchmark stations: U.S. Geological Survey Circular 941, 123 p.
Schertz, T.L., Wells, F.C., and Ohe, D.J., 1994, Sources of trends in water-quality data for selected streams in Texas, 1975-89 water years: U.S. Geological Survey Water-Resources Investigations Report 94-4213, 49 p.
U.S. Department of Agriculture, 1987a, Final environmental impact statement for the forest plan, Idaho Panhandle National Forests: Missoula, Mont., U.S. Department of Agriculture Forest Service, Northern Region.
U.S. Department of Agriculture, 1987b, Forest plan, Idaho Panhandle National Forests: Missoula, Mont., U.S. Department of Agriculture Forest Service, Northern Region.
Weisel, C.J., 1981, Soil survey of Kootenai County area, Idaho: Washington, U.S. Department of Agriculture, Soil Conservation Service, 255 p.
a. U.S. Geological Survey Topographic Maps:
b. Geologic Maps:
c. Soil Surveys:
d. Miscellaneous Maps:
Table B-1. NWIS site-identification numbers and site names for water-quality sampling sites.
|
|
|
|
| 1 | 12416000 | HAYDEN CR BLW N FORK NR HAYDEN LAKE, ID |
| 2 | 474924116360600 | HELLS CANYON NR HAYDEN LK, ID |
| 3 | 474930116384600 | E FORK HAYDEN CR NR HAYDEN LK, ID |
| 4 | 474933116361200 | E FORK HAYDEN CR AB HELLS CNYN NR HAYDEN LK, ID |
| 5 | 474942116385700 | N FORK HAYDEN CR NR HAYDEN LK, ID |
| 6 | 475150116335500 | UPPER CHILCO CR NR HAYDEN LK, ID |
| 7 | 475153116380900 | BRADBURY GULCH NR HAYDEN LK, ID |
| 8 | 475204116365000 | UPPER BRADBURY TRIB NR HAYDEN LK, ID |
| Back to 1173-D Contents |
This page maintained by Nichole Bisceglia.
Last updated August 3, 2000.