
Hydrologic Benchmark Network Stations in the Western U.S. 1963-95 (USGS Circular 1173-D)
To download a printer friendly PDF version of this information click here.
This report details one of the approximately 50 stations in the Hydrologic Benchmark Network (HBN) described in the four-volume U.S. Geological Survey Circular 1173. The suggested citation for the information on this page is:
|
Mast, M.A., and Clow, David W., 2000, Environmental characteristics and water-quality of Hydrologic Benchmark Network stations in the Western United States, U.S. Geological Survey Circular 1173-D, 115 p. |
All of the tables and figures are numbered as they appear in each circular. Use the navigation bar above to view the abstract, introduction and methods for the entire circular, as well as a map and list of all of the HBN sites. Use the table of contents below to view the information on this particular station.
|
Table of Contents |
| 1. Site Characteristics and Land Use |
| 2. Historical Water Quality Data and Time-Series Trends |
| 3. Synoptic Water Quality Data |
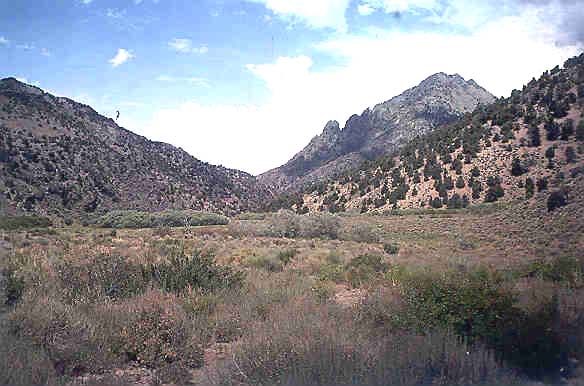
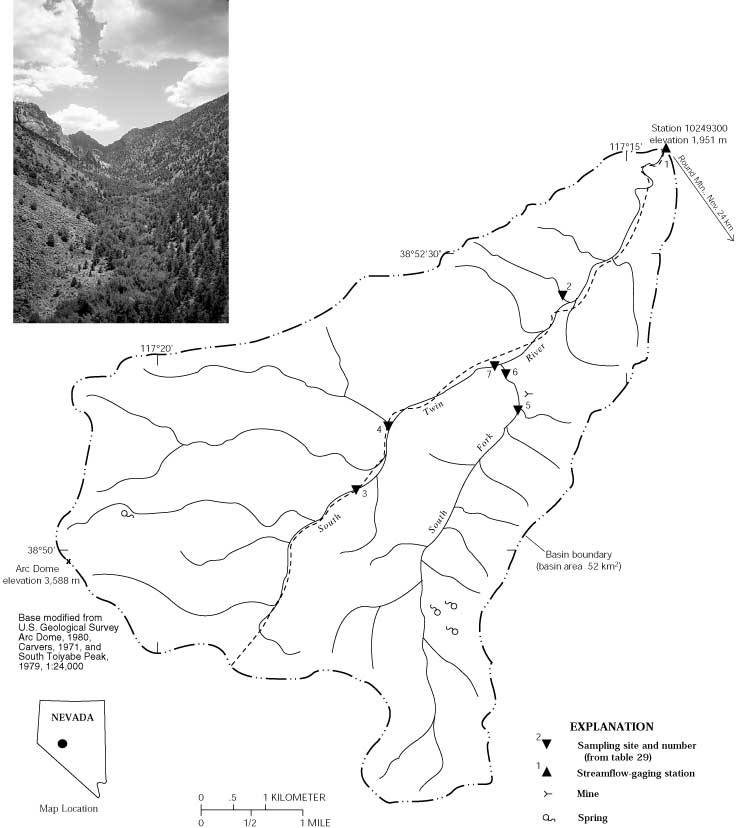
The South Twin River HBN Basin is in the Basin and Range physiographic province in the central part of Nevada (Figure 14. Map showing the study area in the South Twin River Basin and photograph showing the basin landscape). The topography of the area is characterized by north- to northeast-trending mountain ranges separated by long alluviated valleys.
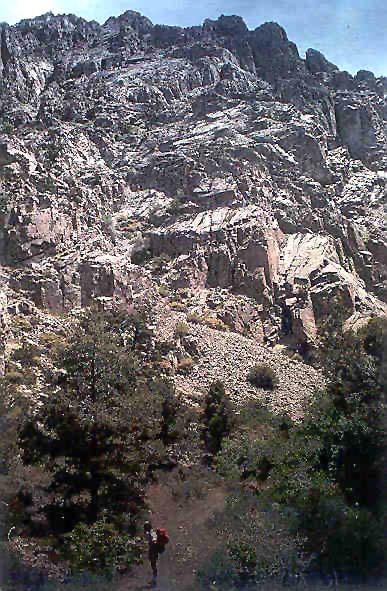 |
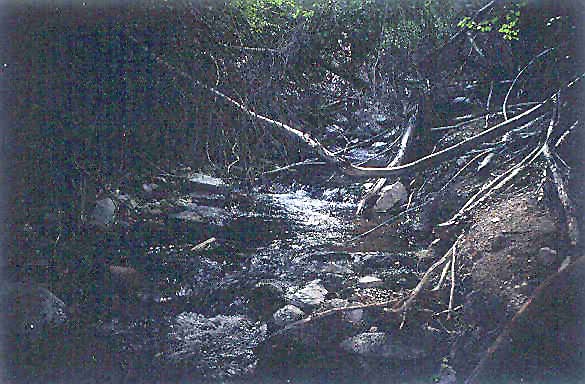
The basin is in the Nevada Mountains Semidesert ecoregion (Bailey and others, 1994). Slopes in the lower part of the basin are covered by a dense juniper-pinyon forest and have an understory of sagebrush that grades upward into mountain big sagebrush and curlleaf mountain mahogany communities above 2,650 m (U.S. Department of Agriculture, 1986b). Small stands of whitebark pine grow near the crest of the range on north-facing canyon walls. Vegetation along streams and around springs is dominated by cottonwood, quaking aspen, water birch, and willow. The mountain big sagebrush and the riparian communities have been degraded by past livestock grazing. The basin also contains large areas of rock outcrops that contain virtually no vegetation (U.S. Department of Agriculture, 1986b). Soils in the basin are classified as Cryoborolls and are in the Foxvire-Packer-Scuffe soil association (John Fisher, Natural Resources Conservation Service, written commun., 1998). This association consists of deep, well-drained loamy soils that formed in residuum and colluvium derived from volcanic rocks. A typical profile has a surface layer of brown gravelly loam that is 50 cm thick overlying a sublayer of light brown, stony to gravelly loam that extends to a depth of 150 cm. Soils in this association have pH values ranging from 6.4 to 7.2 and consist of 45 to 80 percent rock fragments.
Most of the basin is underlain by rocks of the Darrough Felsite of Cretaceous age and several tuff units of Tertiary age (Brem and others, 1991) These units are similar in composition and consist of silicified and variably metamorphosed silicic ash-flow tuffs and volcaniclastic sedimentary rocks. The tuffs are rhyolitic in composition and contain phenocrysts of quartz, orthoclase, oligoclase, albite, and chlorite in a fine-grained, porcelain-like matrix. A small area near the HBN station is underlain by older sedimentary rocks, which contain argillite, siltstone, quartzite, limestone, and dolostone. The northern part of the basin is in the Twin River historic mining district, which has a resource potential for gold, silver, and base metals (Brem and others, 1991). Metallic mineral deposits in the basin are associated with polymetallic veins in the felsite and tuff. These veins range in width
 |
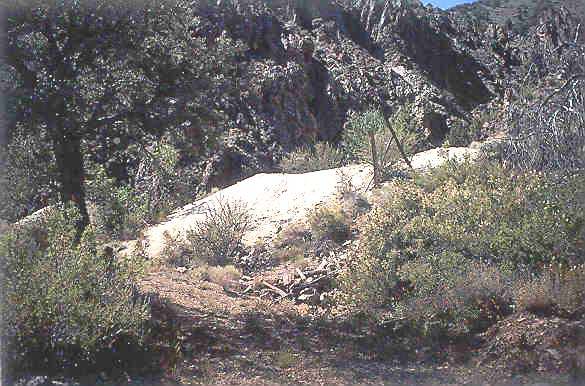
The South Twin River drains the northwest part of Nye County and is in the Tonopah Ranger District of the Toiyabe National Forest. Most of the basin also is in the boundaries of the Arc Dome Wilderness, which was classified as a proposed Wilderness Area in 1979 and received Federal designation on December 12, 1989 (U.S. Department of Agriculture, 1990a). The wilderness is closed to all motorized vehicles and access in the basin is limited to a few foot trails that start from a gated road at the HBN station. Human activities in the basin are limited to dispersed recreational use, including hiking, horseback riding, and hunting. There are no developed recreational sites in the basin, although the trail paralleling the main stream channel is part of the Toiyabe Crest National Recreation Trail system that was constructed by the Civilian Conservation Corps in the 1930's. Until 1991, cattle grazing was allowed in the basin from June through October, which caused considerable damage to riparian areas, particularly along the upper reaches of South Twin River (Tonopah Ranger District, Toiyabe National Forest, oral commun., 1998). Although permitted grazing is no longer allowed, about 30 head of wild cattle occasionally graze in the headwater areas of the basin (Tonopah Ranger District, Toiyabe National Forest, oral commun., 1998). The abandoned mine site (K claims) near the mouth of the South Fork South Twin River contains three underground workings and their associated waste-rock piles. Water produced in the adit does not exit the mine as surface flow and probably is not a substantial source of metals and acidity to stream water because much of the mineralized rock in the mine contains carbonate-filled voids and veinlets (U.S. Department of Agriculture, 1990a). A plan of operation to resume mining at the K claims and to restore an access road was submitted to the Forest Service in 1988 (U.S. Department of Agriculture, 1990a); however, the mine did not prove to be viable and the request was never approved (Tonopah Ranger District, Toiyabe National Forest, oral commun., 1998). A record high runoff in 1983 caused minor damage at the mine site and the access road and scoured much of the main channel of the South Twin River (U.S. Department of Agriculture, 1990a).
The data set for the South Twin River HBN station analyzed for this report includes 192 water-quality samples that were collected from October 1967 through August 1995. Sampling frequency ranged from 7 to 12 times per year from 1968 through 1982 (except 1976 and 1977, which were quarterly) and was quarterly from 1983 to 1995. Samples from the early
 |
Calculated ion balances for 176 samples that have complete major-ion analyses are shown in figures 15a and 15b. Graphs showing temporal variation of discharge, field pH, major-ion concentrations, and ion balance in the South Twin River, Nevada. Ion balances ranged from -12 to +10 percent, and 95 percent of the samples had values within the ±5-percent range, indicating that the analytical results are of high quality. The average ion balance was -0.4 percent, indicating that unmeasured constituents, such as organic anions, are not an important component of stream water at this station. Time-series plots of the major dissolved constituents were inspected for evidence of method-related effects (fig. 15). Field pH values decreased somewhat abruptly at the beginning of 1973, which may have been caused by a change in measurement method or instrumentation used by field personnel. A similar shift in field pH also was observed at Steptoe Creek, another HBN station in Nevada, providing additional evidence that the pattern is probably an analytical artifact. The stepped pattern in the concentrations of nitrite plus nitrate was caused by changes in the analytical reporting limit for this constituent that occurred in 1982 and again in 1991.
[Concentrations in units of microequivalents per liter, discharge in cubic meters per second, specific conductance in microsiemens per centimeter at 25 degrees Celsius, pH in standard units, and silica in micromoles per liter; n, number of stream samples; VMW, volume-weighted mean; inst., instantaneous; spec. cond., specific conductance; <, less than; --, not reported]
| Parameter | Stream Water | Precipitation VMAa | |||||
| Minimum | First Quartile | Median | Third Quartile | Maximum | n | ||
| Discarge, inst. | 0.027 | 0.057 | 0.084 | 0.19 | 4.7 | 192 | -- |
| Spec. cond., field | 72 | 110 | 130 | 130 | 160 | 190 | 5.3 |
| pH, field | 6.6 | 7.7 | 7.9 | 8.1 | 8.9 | 179 | 5.6b |
| Calcium | 440 | 750 | 850 | 950 | 1,200 | 192 | 5.6 |
| Magnesium | 66 | 99 | 120 | 130 | 180 | 189 | 1.3 |
| Sodium | 200 | 250 | 270 | 280 | 320 | 191 | 3.7 |
| Potassium | 13 | 18 | 20 | 23 | 41 | 189 | .7 |
| Ammonium | <.7 | <.7 | 1.4 | 4.3 | 9.3 | 114 | 14 |
| Alkalinity, laboratory | 580 | 1,020 | 1,120 | 1,180 | 1,500 | 190 | -- |
| Sulfate | 20.8 | 100 | 120 | 150 | 270 | 190 | 8.2 |
| Chloride | 17 | 39 | 51 | 56 | 96 | 185 | 2.8 |
| Nitrite plus nitrate | <.7 | 2.9 | 6.4 | 7.1 | 20 | 161 | 11c |
| Silica | 250 | 300 | 320 | 350 | 380 | 192 | -- |
a Values are volume-weighted mean concentrations for 1985-95.
b Laboratory pH.
c Nitrate only.
The median concentrations and ranges of major dissolved constituents in stream water collected at the HBN station and VWM concentrations in wet-only precipitation measured at the Smith Valley NADP station are presented in table 26. Precipitation chemistry at the NADP station, which is about 180 km southwest of the HBN station, is very dilute and slightly acidic and has VWM pH of 5.6 for 11 years of record. The predominant cations in precipitation were calcium and ammonium, which contributed 20 and 50 percent of the total cation charge, respectively. The predominant anions were sulfate and nitrate, which accounted for 37 and 50 percent of the total anion charge, respectively. Stream water in the South Twin River is
 |
The solute composition of stream water was further evaluated by analyzing correlations between solutes and stream discharge (table 27). Most weathering-derived constituents were negatively correlated with stream discharge, which is consistent with a hydrologic system where weathering-enriched base flow is diluted by water from shallow or surficial sources during periods of increased discharge, particularly spring snowmelt. For the solutes, the strongest correlations were found among calcium, magnesium, and alkalinity (0.773 < rho < 0.874), which is consistent with the weathering stoichiometry of carbonate minerals. The poor correlation between sodium and silica (rho = 0.043) was unexpected because feldspar minerals in the volcanic rocks should be the major source of sodium and silica. Sulfate was positively correlated with calcium (rho = 0.625) and magnesium (rho = 0.633), perhaps reflecting the presence of pyrite and carbonate minerals in mineralized veins.
[Q, discharge; Ca, calcium; Mg, magnesium; Na, sodium; K, potassium; Alk, alkalinity; SO4, sulfate; Cl, chloride; N, nitrite plus nitrate; Si, silica]
|
|
|
|
|
|
|
|
|
|
|
| pH | -0.152 | -- | -- | -- | -- | -- | -- | -- | -- |
| Ca | -.348 | 0.168 | -- | -- | -- | -- | -- | -- | -- |
| Mg | -.354 | .176 | 0.874 | -- | -- | -- | -- | -- | -- |
| Na | -.515 | .224 | .695 | 0.645 | -- | -- | -- | -- | -- |
| K | -.027 | .163 | .307 | .287 | 0.311 | -- | -- | -- | -- |
| Alk | -.492 | .273 | .820 | .773 | .768 | 0.327 | -- | -- | -- |
| SO4 | -.182 | .040 | .625 | .633 | .479 | .143 | 0.488 | -- | -- |
| Cl | .062 | .166 | .471 | .415 | .326 | .126 | .372 | 0.408 | -- |
| Si | -.213 | .117 | -.297 | -.288 | .043 | .130 | -.085 | -.370 | -0.276 |
[Trends in units of microequivalents per liter per year, except for discharge in cubic meters per second per year, pH in standard units per year, and silica in micromoles per liter per year; <, less than; --, not calculated]
| Parameter |
Unadjusted
|
Flow adjusted
|
||
|
Trend
|
p-value
|
Trend
|
p-value
|
|
| Discharge |
<0.001
|
0.999
|
--
|
--
|
| pH, field |
<.01
|
.491
|
<0.01
|
0.430
|
| Calcium |
<.1
|
.400
|
-1.0
|
.527
|
| Magnesium |
<.1
|
.044
|
-.4
|
.050
|
| Sodium |
.3
|
.166
|
.3
|
.168
|
| Potassium |
-.1
|
.000
|
-.1
|
.000
|
|
Alkalinity, laboratory
|
<.1
|
.503
|
.5
|
.652
|
| Sulfate |
-.7
|
.029
|
-.6
|
.031
|
| Chloride |
<.1
|
.964
|
<.1
|
.955
|
| Nitrite plus nitrate |
.1a
|
.200
|
--
|
--
|
| Silica |
<.1
|
.284
|
-.3
|
.128
|
a Trend calculated for 1971-95 using a trend test for censored data.
The results of the seasonal Kendall test for trends in discharge and major dissolved constituents are listed in table 28. A statistically significant trend was detected only in potassium concentrations at the 0.01 probability level. The magnitude and probability of the trend were similar for the unadjusted and flow-adjusted concentrations, indicating that the potassium trend was not caused by variations in stream discharge. The absence of trends in the major solutes was not unexpected because the basin is in a wilderness area and has had little land use, except grazing. The cause of the downward trend in potassium concentrations could not be identified. The LOWESS curve in figure 15 shows that potassium concentrations were fairly constant during the early part of the period of record and then declined gradually after 1984. The decrease in potassium probably was not an analytical artifact because the samples were analyzed at the NWQL since 1976 using a single technique. Environmental factors that may have affected stream-water potassium concentrations included livestock grazing and atmospheric deposition. The effect of cattle grazing on stream-water potassium concentrations is not known; however, grazing pressure in riparian areas has been substantially decreased since the establishment of the wilderness in 1979. Lynch and others (1995) reported declines in base-cation concentrations, including potassium, at several NADP stations in the southwestern part of the United States between 1980 and 1992. Although the trend in precipitation chemistry is consistent with the decline in stream-water potassium, confirmation of the linkage between precipitation and stream chemistry is difficult because no precipitation stations are located in or near the South Twin River Basin.
Results of the surface-water synoptic sampling of July 23-24, 1991, are presented in table 29, and locations of sampling sites are shown in figure 14. During the synoptic sampling, discharge at the HBN station was 0.082 m³/s compared to the median daily discharge of 0.12 m³/s for July and 0.07 m³/s for August (Lawrence, 1987), indicating that the basin was sampled under normal flow conditions for that time of year. Most of the solute concentrations measured at the HBN station (site 1) during the synoptic sampling were less than the first-quartile values reported for the station during the entire period of record, except for sodium and silica concentrations, which were higher (table 26). Water in the tributary streams were similar in composition to stream water at site 1, with calcium and bicarbonate the predominant solutes. Ion balances for the synoptic samples averaged 0.1 percent (ranging from -2.7 to 4.9 percent), indicating that unmeasured ions, such as organic anions, probably were not an important component of stream water during the synoptic sampling. Concentrations of the weathering-derived solutes did not vary markedly among the sampling sites, probably because of the small basin size and the relatively uniform composition of the bedrock. For example, calcium ranged from 360 to 900 meq/L, and alkalinity ranged from 620 to 1,180 meq/L (table 29). Silica was remarkably constant, varying only from 330 to 350 mmol/L. Sulfate concentrations also were fairly uniform and relatively low (average about 70 meq/L), particularly considering the presence of several mineralized zones in the basin. Site 4, which drains a weakly mineralized area on a southeast-facing slope, had the highest sulfate concentration. The high chloride concentration and southerly aspect of this site, however, may indicate that the high sulfate concentration is due to evapotranspiration rather than weathering of sulfides. The abandoned mine site did not seem to affect stream chemistry during the synoptic sampling, as evidenced by the similar stream chemistry upstream (site 5) and downstream from the mine (site 6). However, because the waste-rock piles at the mine site are located near the stream, they may have a disproportionate effect on stream-water chemistry during spring snowmelt or summer thundershowers when direct runoff is more likely to enter the stream. Nitrate concentrations were extremely low at all sampling sites (<3.6 meq/L), which is consistent with the minimal amount of land use in the basin.
[Site locations shown in fig. 14; Q, discharge in cubic meters per second; SC, specific conductance in microsiemens per centimeter at 25 degrees Celsius; pH in standard units; Ca, calcium; Mg, magnesium; Na, sodium; K, potassium; Alk, alkalinity; SO4, sulfate; Cl, chloride; NO3, nitrate; Si, silica; concentrations in microequivalents per liter, except silica in micromoles per liter; <, less than; --, not reported]
| Site | Station number | Q | SC | pH | Ca | Mg | Na | K | Alk | S04 | Cl | NO3 | Si | Criteriaa | Remarks |
| 1 | 10249300 |
0.082
|
100
|
8.0 |
700
|
88
|
270
|
21
|
930
|
77
|
39
|
<3.6
|
350
|
--
|
-- |
| 2 | 384500117145900 |
--
|
110
|
7.4 |
700
|
96
|
260
|
20
|
1,040
|
69
|
23
|
<3.6
|
350
|
BG
|
Felsite bedrock |
| 3 | 384901117175500 | .016 | 65 | 8.0 | 360 | 47 | 240 | 17 | 620 | 46 | 21 |
1.4
|
350 |
BG
|
Tuffaceous bedrock |
| 4 | 384926117173100 | .006 | 120 | 8.0 | 800 | 88 | 320 | 25 | 1,120 | 110 | 56 |
<3.6
|
330 |
BG
|
Tuff and felsite, weakly mineralized |
| 5 | 384931117161000 | .014 | 120 | 8.0 | 850 | 110 | 280 | 21 | 1,180 | 60 | 17 | <3.6 | 330 |
LU
|
Upstream from mine site |
| 6 | 384946117161800 | .012 | 130 | 8.0 | 900 | 110 | 300 | 22 | 1,180 | 73 | 28 | <3.6 | 330 |
LU, MT
|
Downstream from mine site and mineralized area |
| 7 | 384947117162000 | .053 | 79 | 7.9 | 490 | 55 | 250 | 19 | 650 | 63 | 28 | .7 | 350 |
LU, MT
|
Downstream from pasture area |
a Criteria used in selection of sampling sites: BG = bedrock geology, MT = major tributary, LU = land use.
Bailey, R.G., Avers, P.E., King, T., McNab, W.H., eds., 1994, Ecoregions and subregions of the United States with supplementary table of map unit descriptions: Washington, D.C., U.S. Department of Agriculture, Forest Service, scale 1:7,500,000.
Bauer, D.J., Foster, B.J., Joyner, J.D., and Swanson, R.A., 1996, Water resources data, Nevada, water year 1995: U.S. Geological Survey Water-Data Report NV-95-1, 734 p.
Brem, G.F., John, D.A., Nash, J.T., Poole, F.G., and Snyder, D.B., 1991, Mineral resources of the Arc Dome Wilderness Recommendation Area, Nye County, Nevada: U.S. Geological Survey Bulletin 1961, 21 p.
Durum, W.H., 1978, Historical profile of quality of water laboratories and activities, 1879-1973: U.S. Geological Survey Open-File Report 78-432, 235 p.
Lawrence, C.L., 1987, Streamflow characteristics at hydrologic benchmark stations: U.S. Geological Survey Circular 941, 123 p.
Lynch, J.A., Grimm, J.W., and Bowersox, V.C., 1995, Trends in precipitation chemistry in the United States-A national perspective, 1980-1992: Atmospheric Environment, v. 29, no. 11, p. 1231-1246.
U.S. Department of Agriculture, 1986b, Land and resource management plan, final environmental impact statement, Toiyabe National Forest: Ogden, Utah, U.S. Department of Agriculture Forest Service, Intermountain Region.
U.S. Department of Agriculture, 1990a, Final environmental impact statement for the South Twin Load mining and development proposal, Nye County, Nevada: Ogden, Utah, U.S. Department of Agriculture Forest Service, Intermountain Region.
a. U.S. Geological Survey Topographic Maps:
b. Geologic Maps:
c. Soil surveys: No soil survey available
d. Miscellaneous Maps:
Table B-1. NWIS site-identification numbers and site names for water-quality sampling sites.
|
|
|
|
| 1 | 10249300 | SOUTH TWIN R NR ROUND MOUNTAIN, NV |
| 2 | 384500117145900 | FIRST NORTH TRIB TO SOUTH TWIN R NR CARVERS, NV |
| 3 | 384901117175500 | SOUTH TWIN R AB PASTURE NR CARVERS, NV |
| 4 | 384926117173100 | NORTH TWIN R TTRAIL TRIB NR CARVERS, NV |
| 5 | 384931117161000 | SOUTH FORK ABOVE MINE NR CARVERS, NV |
| 6 | 384946117161800 | SOUTH FORK OF SOUTH TWIN R NR CARVERS, NV |
| 7 | 384947117162000 | SOUTH TWIN R AB SOUTH FORK NR CARVERS, NV |
| Back to 1173-D Contents |
This page maintained by Nichole Bisceglia.
Last updated August 3, 2000.