
Hydrologic Benchmark Network Stations in the Western U.S. 1963-95 (USGS Circular 1173-D)
To download a printer friendly PDF version of this information click here.
This report details one of the approximately 50 stations in the Hydrologic Benchmark Network (HBN) described in the four-volume U.S. Geological Survey Circular 1173. The suggested citation for the information on this page is:
|
Mast, M.A., and Clow, David W., 2000, Environmental characteristics and water-quality of Hydrologic Benchmark Network stations in the Western United States, U.S. Geological Survey Circular 1173-D, 115 p. |
All of the tables and figures are numbered as they appear in each circular. Use the navigation bar above to view the abstract, introduction and methods for the entire circular, as well as a map and list of all of the HBN sites. Use the table of contents below to view the information on this particular station.
|
Table of Contents |
| 1. Site Characteristics and Land Use |
| 2. Historical Water Quality Data and Time-Series Trends |
| 3. Synoptic Water Quality Data |
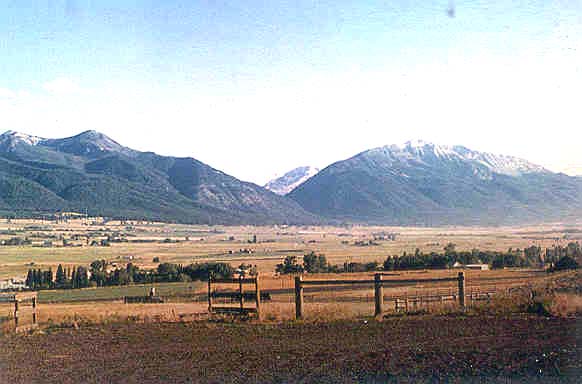
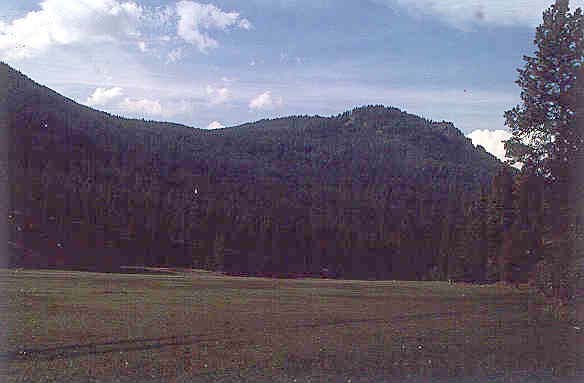
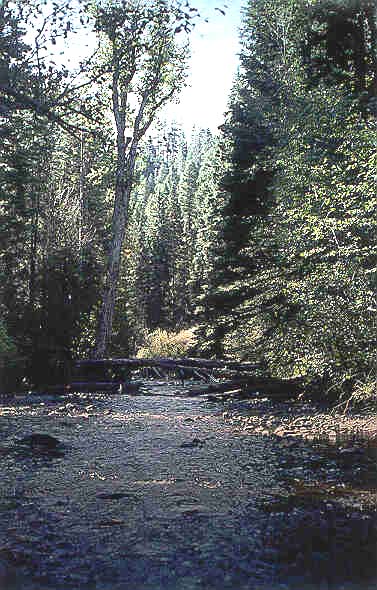
The Minam River HBN Basin is located in the Columbia Plateaus physiographic province in the Wallowa Mountains in northeastern Oregon (Figure 20. Map showing the study area in the Minam River Basin and photograph showing the landscape in the headwaters). The 622-km² basin ranges in elevation from 774 to 2,780 m and is characterized by a long, U-shaped valley bounded by jagged ridges and alpine cirques. The HBN station is located 0.5 km west of the town of Minam, Oreg., at latitude 45°37'12'' and longitude 117°43'32''. The Minam River flows northwest into the Wallowa River, a tributary of the Snake River, and has a channel length of 73 km upstream from the HBN station and an average stream gradient of 13.0 m/km. The main channel is perennial, and mean monthly discharge varies from a minimum of 2.7 m³/s in October to a
 |
The basin is in the Southern Rocky Mountains ecoregion and has a high diversity of plant communities that vary with landform, elevation, and aspect (Bailey and others, 1994). Below 2,000 m, forests are dominated by Douglas-fir, although ponderosa pine, western larch, lodgepole pine, and grand fir may be locally abundant (Cole, 1982). Common understory species in this forest community are Grouse huckleberry, big huckleberry, pinegrass, Idaho fescue, bluegrass, and bluebunch wheatgrass. The subalpine fir community dominates most forested sites between 2,000 and 2,300 m (Cole, 1982). The predominant species are subalpine fir and Englemann spruce; the understory is grouse whortleberry. The highest elevations in the basin are dominated by stands of whitebark pine and subalpine fir interspersed with subalpine grasslands and meadows. Other predominant species in this zone include alpine sagebrush, sandwort, fleeceflower, needlegrass, lupine, elk sedge, paintbrush, yarrow, and mosses (Wallowa-Whitman National Forest, written commun., 1998). Little information is available on soil conditions and characteristics in the Eagle Cap Wilderness (U.S. Department of Agriculture, 1995). Most soils in the Wallowa Mountains contain volcanic ash from the eruption of Mount Mazama 6,850 years ago, that has been redeposited and mixed with colluvium and alluvium from local bedrock sources.
Bedrock in the basin consists of intrusive rocks of Cretaceous age that are overlain by basalts of the Columbia River Basalt Group of Tertiary age (Weis and others, 1976). Intrusive rocks include granites of the Wallowa Batholith that are extensively exposed in the upper part of the basin roughly south of Reds Horse Ranch. The granite is generally light gray and medium grained and consists of quartz, plagioclase, hornblende, and biotite. The granite is intruded by aplite, pegmatite, and basalt dikes that range from 8 to 90 cm in width and is cut by several widely spaced joint sets. The basalts of the Columbia River Basalt Group cover the flanks of the Wallowa Range and are exposed along the lower reaches of the river canyon. The Columbia River Basalt Group consists of dark-colored lava flows that range in thickness from 9 to 30 m. The Wallowa Mountains were extensively glaciated during the late Pleistocene, and glacial deposits are present on the walls and floors of the
 |
The Minam River HBN Basin drains parts of Union and Wallowa Counties in Oregon. More than 90 percent of the basin is in the Eagle Cap Wilderness in the Wallowa-Whitman National Forest, and the remainder is privately owned. Almost all of the basin is roadless, except for the area north of the national forest boundary and a few areas along the western basin divide. The national forest maintains a 165-km trail system that parallels the entire length of the main channel of the Minam River, as well as several of the major tributaries. The Eagle Cap Wilderness was created in 1964 and is managed under a nondegradation principle, which seeks to maintain the wilderness in at least as wild a condition as it was at the time of classification (U.S. Department of Agriculture, 1990b). The upper 65 km of the Minam River was added to the National Wild and Scenic Rivers System in 1988 and has the distinction of being the only component of the system to be entirely within a wilderness area (U.S. Department of Agriculture, 1995). Recreation is the major human-related activity in the basin, including backpacking, horsepacking, hunting, and fishing.
The well-maintained trail system and ease of access make the Eagle Cap Wilderness one of the most heavily used wilderness areas in Oregon. About 800 people visit the Minam River corridor each year, of which about 30 percent are with commercial outfitters and guides (U.S. Department of Agriculture, 1995). The basin contains two backcountry lodges (Minam Lodge and Reds Horse Ranch), a landing strip located along the river in the center of the basin, and a homestead on the Little Minam River used as an administrative site by the Forest Service. The Minam Lodge is still privately owned and operated; however, Reds Horse Ranch was purchased by the Forest Service in 1994 and since then has been used as an administrative facility. Although recreation is currently the only land use, timber harvesting and grazing have been important in the past. Logging occurred from 1918 to 1924, and a splash dam was constructed 9.7 km upstream from Reds Horse Ranch. The dam was removed in 1947 (U.S. Department of Agriculture, 1995). A small amount of timber harvesting has occurred in the basin in upper Squaw Creek and along the western margin of the basin since the establishment of the HBN station. Until 1940, the river corridor was heavily grazed by sheep and cattle, which resulted in some plant community alterations in the basin. However, grazing allotments in the basin have not been stocked since 1985, and range conditions have improved steadily (U.S. Department of Agriculture, 1995).
The data set for the Minam River HBN station that was analyzed for this report includes 204 water- quality samples that were collected from January 1966 through August 1995. Samples were collected 2 to 14 times per year from 1966 to 1982 and
 |
Calculated ion balances for 204 samples that have complete major-ion analyses are shown in figures 21a and 21b. Graphs showing temporal variation of discharge, field pH, major-ion concentrations, and ion balance in the Minam River, Oregon. Ion balances ranged from -31 to +16 percent, and 85 percent of samples had values in the ±10-percent range, indicating that the analytical measurements were of good quality. The average charge balance for all samples was -1.4 percent, and 60 percent of samples had slightly negative ion balances, indicating an excess of measured anions compared to cations. Natural water more commonly has an excess of cations because of the presence of unmeasured organic anions. An anion excess is more difficult to explain than a cation excess and may indicate a bias in one of the analytical measurements. Time-series plots of the major dissolved constituents were inspected for evidence of other method-related effects (fig. 21). The most notable pattern was observed in sulfate concentrations, which were higher during the middle of the period of record, particularly during the 1980's. The high concentrations in the 1980's coincided with the period when sulfate was analyzed by the turbidimetric titration technique. In 1989, the NWQL determined that sulfate concentrations can be overestimated by this technique and changed the technique to ion chromatography in 1990 (Office of Water Quality Technical Memorandum No. 90.04, Turbidimetric sulfate method, issued December 21, 1989, at URL http://water.usgs.gov/admin/memo/). The bias was most pronounced in dilute waters, although it was not consistent among samples and seemed to be affected by other factors, such as color and turbidity (Schertz and others, 1994). In addition to the analytical bias, some of the elevated sulfate concentrations in 1982 and 1983 reflect an increase in the analytical reporting limit for sulfate from 21 meq/L (1.0 mg/L) to 104 meq/L (5.0 mg/L) during those 2 years of record.
[Concentrations in units of microequivalents per liter, discharge in cubic meters per second, specific conductance in microsiemens per centimeter at 25 degrees Celsius, pH in standard units, and silica in micromoles per liter; n, number of stream samples; VMW, volume-weighted mean; inst., instantaneous; spec. cond., specific conductance; <, less than; --, not reported]
| Parameter | Stream Water | Precipitation VMAa | |||||
| Minimum | First Quartile | Median | Third Quartile | Maximum | n | ||
| Discarge, inst. | 0.99 | 3.2 | 6.2 | 16 | 100 | 204 | -- |
| Spec. cond., field | 19 | 42 | 52 | 56 | 137 | 204 | 3.6 |
| pH, field | 6.6 | 7.2 | 7.5 | 7.7 | 9.2 | 192 | 5.3b |
| Calcium | 120 | 250 | 300 | 330 | 440 | 201 | 2.6 |
| Magnesium | 25 | 82 | 120 | 140 | 190 | 201 | .9 |
| Sodium | 35 | 83 | 100 | 110 | 150 | 201 | .9 |
| Potassium | 10 | 23 | 28 | 31 | 54 | 203 | .4 |
| Ammonium | <.7 | <.7 | 1.4 | 4.3 | 14 | 81 | 2.9 |
| Alkalinity, laboratory | 180 | 390 | 500 | 560 | 720 | 191 | -- |
| Sulfate | <2.1 | 17 | 33 | 53 | 210 | 203 | 4.6 |
| Chloride | <2.8 | 8.5 | 14 | 20 | 76 | 201 | 1.8 |
| Nitrite plus nitrate | <.7 | 1.4 | 5.7 | 7.1 | 31 | 162 | 4.8c |
| Silica | 60 | 250 | 280 | 370 | 510 | 202 | -- |
a Values are volume-weighted mean concentrations for 1984-95.
b Laboratory pH.
c Nitrate only.
The median concentrations and ranges of major dissolved constituents in stream water collected at the HBN station and VWM concentrations in wet-only precipitation measured at the Starky Experimental Station NADP site are presented in table 37. Precipitation chemistry at the NADP station, which is about 80 km southwest of the HBN station, is very dilute and slightly acidic and has a VWM pH of 5.3 for 12 years of record. The predominant cations in precipitation were hydrogen ion,
 |
Stream water in the Minam River is fairly dilute and moderately buffered; specific conductance ranged from 19 to 137 mS/cm and alkalinity ranged from 180 to 720 meq/L (table 37). The major cations in stream water were calcium, magnesium, and sodium, and the major anion was bicarbonate. The predominance of these solutes in stream water, in addition to the relatively high concentrations of silica, is consistent with the weathering stoichiometry of plagioclase, hornblende, and biotite in the granitic rocks and more mafic minerals in rocks of the Columbia River Basalt Group. The median concentration of chloride in stream water was 14 meq/L, which is about 8 times greater than the VWM concentration of 1.8 meq/L in precipitation. Based on the difference between precipitation and runoff, evapotranspiration can account for no more than a threefold increase in the chloride concentration of precipitation, indicating that some stream-water chloride is derived from sources other than wet precipitation. Because land-use activities in the basin are minimal, the only plausible sources of additional stream-water chloride are dust from arid valleys surrounding the Wallowa Mountains (Turk and Spahr, 1991) and weathering of amphibole minerals in the granitic and basaltic bedrock (Peters, 1991). The median concentration of sulfate in stream water was 33 meq/L compared to the VWM concentration of 4.6 meq/L and was slightly higher than was expected based solely on the effects of evapotranspiration. As with chloride, these results may indicate that there are additional sources of stream-water sulfate, such as bedrock weathering or eolian dust. Alternatively, stream-water sulfate may be high relative to concentrations in precipitation because of analytical bias in the historical records rather than because of natural sources. Most concentrations of inorganic nitrogen species in stream water were similar to VWM concentrations in precipitation, indicating that not all atmospheric nitrogen is retained by vegetation and soil in the basin.
The solute composition of stream water was further evaluated by analyzing correlations between solutes and stream discharge (table 38). Most weathering-derived solutes were negatively correlated with stream discharge, particularly calcium (rho = -0.649), sodium (rho = -0.643), and alkalinity (rho = -0.579). These results are consistent with a hydrologic system where weathering-enriched base flow is diluted by water from shallow or surficial sources during periods of increased discharge, particularly spring snowmelt. For the solutes, the strongest correlations were found among base cations, alkalinity and silica, which is consistent with the weathering stoichiometry of silicate minerals in the granitic and basaltic bedrock. A strong correlation between silica and magnesium (rho = 0.866) is somewhat unusual and may reflect the weathering of magnesium silicate minerals, such as biotite and hornblende, in the granitic rocks or mafic minerals in the basalt. Sulfate and chloride were weakly correlated with discharge and with the major solutes, supporting the assumption that most sulfate and chloride are derived from atmospheric deposition.
[Q, discharge; Ca, calcium, Mg, magnesium; Na, sodium; K, potassium; Alk, alkalinity; SO4, sulfate; Cl, chloride; Si, silica]
|
|
|
|
|
|
|
|
|
|
|
| pH | -0.241 | -- | -- | -- | -- | -- | -- | -- | -- |
| Ca | -.649 | 0.093 | -- | -- | -- | -- | -- | -- | -- |
| Mg | -.414 | .101 | 0.731 | -- | -- | -- | -- | -- | -- |
| Na | -.643 | .214 | .811 | 0.776 | -- | -- | -- | -- | -- |
| K | -.468 | .108 | .571 | .636 | 0.637 | -- | -- | -- | -- |
| Alk | -.579 | .218 | .754 | .753 | .784 | 0.600 | -- | -- | -- |
| SO4 | -.026 | -.139 | .238 | .165 | .127 | .146 | 0.038 | -- | -- |
| Cl | -.130 | .171 | .342 | .411 | .264 | .296 | .310 | 0.222 | -- |
| Si | -.231 | .056 | .607 | .866 | .687 | .623 | .688 | .170 | 0.362 |
[Trends in units of microequivalents per liter per year, except for discharge in cubic meters per second per year, pH in standard units per year, aluminum, iron, and silica in micromoles per liter per year; <, less than; --, not calculated]
| Parameter |
Unadjusted
|
Flow adjusted
|
||
|
Trend
|
p-value
|
Trend
|
p-value
|
|
| Discharge |
-0.02
|
0.662
|
--
|
--
|
| pH, field |
.02
|
.001
|
0.02
|
0.001
|
| Calcium |
-.5
|
.395
|
-.3
|
.369
|
| Magnesium |
<.1
|
.952
|
-.1
|
.653
|
| Sodium |
<.1
|
.702
|
-.1
|
.467
|
| Potassium |
<.1
|
.582
|
<.1
|
.554
|
|
Alkalinity, laboratory
|
<.1
|
.266
|
.2
|
.757
|
| Sulfate |
.4
|
.203
|
(a)
|
--
|
| Chloride |
<.1
|
.902
|
(a)
|
--
|
| Nitrite plus nitrate |
(b)
|
--
|
--
|
--
|
| Silica |
<.1
|
.289
|
.1
|
.658
|
a Flow model not significant at a = 0.10.
b Insufficient data to calculate trend.
The results of the seasonal Kendall test for trends in discharge and major dissolved constituents are listed in table 39. A statistically significant upward trend was detected in unadjusted field pH at the 0.01 probability level. The trend was similar for the unadjusted and flow-adjusted pH values, indicating that it was not caused by variations in stream discharge. The LOWESS curve in figure 21 shows that field pH was at a minimum in the late 1970's and that most of the trend was caused by an increase in pH during the 1980's. One possible explanation for the trend in stream-water pH was a change in atmospheric deposition. Lynch and others (1995) reported statistically significant downward trends in hydrogen ion and sulfate and chloride concentrations at several NADP stations in the Northwestern United States from 1980 to 1992. Although the upward trend in stream-water pH is consistent with the downward trend in precipitation acidity, trends were not detected in stream-water sulfate or chloride concentrations as might be expected if changes in atmospheric deposition were affecting stream-water chemistry. Alternatively, the trend in field pH may have been caused by a method-related factor, such as a change in field pH meters or electrodes. Some instrument-electrode systems produce erroneous readings, particularly when measuring pH in low-conductivity water (Office of Water Quality Technical Memorandum No. 81.08, Electrodes for pH measurement in low- conductivity waters, issued February 10, 1981, at URL http://water.usgs.gov/admin/memo/, accessed 1998). The absence of trends in the other stream-water solutes was not unexpected because of the pristine condition of the basin and the minimal amount of human activity during the past 30 years.
Chemical results of the surface-water synoptic sampling of August 13-;18, 1993, are listed in table 40, and locations of sampling sites are shown in figure 20. During the synoptic sampling, discharge at the HBN station was 2.9 m³/s compared to the median daily discharge of 3.2 m³/s for August (Lawrence, 1987), indicating that the basin was sampled during near normal flow conditions for that time of year. Most of the solute concentrations measured at the HBN station (site 1) during the synoptic sampling were between the first-quartile and median concentrations reported for the station during the entire period of record, except for the chloride concentration, which was lower (table 37). The predominant solutes at the upstream sampling sites were calcium and bicarbonate, and the concentrations bracketed the concentrations measured at site 1. The average ion balance for all the synoptic samples was 1.0 percent (ranging from -1.7 to 4.1 percent), indicating that unmeasured ions, such as organic anions, did not contribute greatly to the ionic content of stream water during the synoptic sampling.
[Site locations shown in fig. 20; Q, discharge in cubic meters per second; SC, specific conductance in microsiemens per centimeter at 25 degrees Celsius; pH in standard units; Ca, calcium; Mg, magnesium; Na, sodium; K, potassium: Alk, alkalinity; SO4, sulfate; Cl, chloride; NO3, nitrate; Si, silica; concentrations in microequivalents per liter, except silica in micromoles per liter; <, less than; --, not reported]
| Site | Station number | Q | SC | pH | Ca | Mg | Na | K | Alk | S04 | Cl | NO3 | Si | Criteriaa | Remarks |
| 1 | 13331500 |
2.9
|
54
|
7.0 |
300
|
100
|
91
|
26
|
500
|
17
|
7.9
|
<0.4
|
270
|
--
|
Downstream from wilderness boundary |
| 2 | 453007117411000 |
--
|
54
|
8.0 |
300
|
100
|
91
|
28
|
510
|
17
|
8.2
|
<.4
|
270
|
BG, MC
|
Mixed lithology |
| 3 | 452356117401300 | 2.5 | 51 | 7.8 | 300 | 79 | 83 | 28 | 470 | 20 | 8.2 |
<.4
|
230 |
BG, MC
|
Mixed lithology |
| 4 | 452049117372600 | 1.9 | 50 | 7.5 | 320 | 70 | 110 | 28 | 450 | 19 | 8.2 |
<.4
|
230 |
BG, MC
|
Granite |
| 5 | 450852117213500 | .043 | 34 | 6.8 | 200 | 18 | 65 | 13 | 200 | 96 | 2.8 | <.4 | 140 |
BG, MC
|
Granite |
| 6 | 450853117233000 | -- | 32 | 6.9 | 200 | 28 | 52 | 20 | 290 | 15 | 3.1 | 1.1 | 130 | BG, T | Granite |
| 7 | 451230117293500 | .11 | 41 | 7.0 | 270 | 37 | 57 | 22 | 350 | 9.2 | 3.1 | <.4 | 150 | BG, T | Granite |
| 8 | 451621117320000 | .33 | 38 | 7.0 | 250 | 49 | 83 | 25 | 350 | 10 | 6.2 | <.4 | 180 | BG, T | Granite |
| 9 | 452358117402200 | .76 | 58 | 7.9 | 290 | 160 | 140 | 26 | 570 | 10 | 6.5 | <.4 | 430 | BG, T | Basalt |
| 10 | 453013117410000 | .051 | 61 | 7.8 | 280 | 180 | 140 | 38 | 580 | 12 | 6.8 | <.4 | 520 | BG, T | Basalt |
a Criteria used in selection of sampling sites: BG = bedrock geology, MC = main channel, T = tributary.
Variations in the concentrations of the major solutes indicate that bedrock type seems to be the predominant factor controlling spatial variability in surface-water chemistry. This can be seen by comparing the chemistry of tributaries draining granitic rocks (sites 4-;8) with tributaries that drain only basaltic rocks (sites 9 and 10). For example, magnesium concentrations were, on average, 4 times higher in streams draining basalt than in streams draining granite and sodium concentrations were about 2 times higher. Alkalinity and silica averaged 575 meq/L and 475 mmol/L, respectively, for the basaltic streams compared to 328 meq/L and 166 mmol/L, respectively, for the granitic streams. Although data are available for only two tributaries draining basalt, this pattern seems to reflect the higher weathering rates and more mafic composition of silicate minerals in the basalt compared to plagioclase and hornblende in the granite. Concentrations of the weathering-derived constituents in the five samples collected along the main channel of the Minam River (sites 1-;5) generally decreased with increasing distance upstream from the HBN station. This pattern is consistent with the concept that granitic bedrock in the upper part of the basin contains slower weathering minerals than the basaltic rocks in the lower part of the basin. Another contributing factor is that stream water in the upper part of the basin should have a shorter contact time with soils and bedrock than stream water in lower reaches of the basin. The one exception to the pattern in stream chemistry was sulfate, which was 5 times higher at the headwaters site (site 5) than at the HBN station (site 1). Because sulfate concentrations were not elevated at any of the other main channel or tributary sites, there is probably a local source of sulfate in the headwaters of the basin, the most likely being several mineralized veins that are mapped on the ridgeline just above the sampling site (Weis and others, 1976). Chloride and nitrate concentrations were uniformly low at all the sampling sites; chloride ranged from 2.8 to 8.2 meq/L, and nitrate concentrations were less than 1.2 meq/L at all the sampling sites (table 40). These results are consistent with the low concentrations of chloride and nitrate in precipitation and provide no evidence that human-related activities affected stream-water concentrations of these solutes during the sampling period.
Bailey, R.G., Avers, P.E., King, T., McNab, W.H., eds., 1994, Ecoregions and subregions of the United States with supplementary table of map unit descriptions: Washington, D.C., U.S. Department of Agriculture, Forest Service, scale 1:7,500,000.
Cole, D.N., 1982, Vegetation of two drainages in Eagle Cap Wilderness, Wallowa Mountains, Oregon: Ogden, Utah, U.S. Department of Agriculture Forest Service, Intermountain Forest and Range Experiment Station, Research Paper INT-288, 26 p.
Durum, W.H., 1978, Historical profile of quality of water laboratories and activities, 1879-1973: U.S. Geological Survey Open-File Report 78-432, 235 p.
Hubbard, L.E., Herrett, T.A., Poole, J.E., Ruppert, G.P., and Courts, M.L., 1996, Water resources data, Oregon, water year 1995: U.S. Geological Survey Water-Data Report OR-95-1, 452 p.
Lawrence, C.L., 1987, Streamflow characteristics at hydrologic benchmark stations: U.S. Geological Survey Circular 941, 123 p.
Lynch, J.A., Grimm, J.W., and Bowersox, V.C., 1995, Trends in precipitation chemistry in the United States-A national perspective, 1980-1992: Atmospheric Environment, v. 29, no. 11, p. 1231-1246.
National Climatic Data Center, 1997, Summary of the day: Boulder, Colorado, EarthInfo Incorporated, CD-ROM.
Peters, N.E., 1991, Chloride cycling in two forested lake watersheds in the west-central Adirondack Mountains, New York, U.S.A.: Water, Air, and Soil Pollution, v. 59, p. 201-215.
Schertz, T.L., Wells, F.C., and Ohe, D.J., 1994, Sources of trends in water-quality data for selected streams in Texas, 1975-89 water years: U.S. Geological Survey Water-Resources Investigations Report 94-4213, 49 p.
Turk, J.T., and Spahr, N.E., 1991, Rocky Mountains, in Charles, D.F., ed., Acidic deposition and aquatic ecosystems-Regional case studies: New York, Springer-Verlag, p. 48-92.
U.S. Department of Agriculture, 1990b, Land and resource management plan-Wallowa-Whiteman National Forest: Portland, Oreg., U.S. Department of Agriculture Forest Service, Pacific Northwest Region.
U.S. Department of Agriculture, 1995, Eagle Cap Wilderness-Minam Wild and Scenic River-Environmental assessment: Baker City, Wash., U.S. Department of Agriculture Forest Service, Wallowa-Whitman National Forest, 149 p.
Weis, P.L., Gualtieri, J.L., Cannon, W.F., Tuchek, E.T., McMahan, A.B., and Federspiel, F.E.,1976,Mineral resources of the Eagle Cap Wilderness and adjacent areas, Oregon: U.S. Geological Survey Bulletin 1385-E, 100 p.
a. U.S. Geological Survey Topographic Maps:
b. Geologic Maps:
c. Soil surveys: No soil surveys available.
d. Miscellaneous Maps:
Table B-1. NWIS site-identification numbers and site names for water-quality sampling sites.
|
|
|
|
| 1 | 13331500 | MINAM R AT MINAM, OR |
| 2 | 453007117411000 | MINAM R AB TROUT CR NR MINAM, OR |
| 3 | 452356117401300 | MINAM R AB LITTLE MINAM NR MINAM, OR |
| 4 | 452049117372600 | MINAM R AB REDS HORSE RANCH NR MINAM, OR |
| 5 | 450852117213500 | MINAM R AT FRASIER MEADOW NR MINAM, OR |
| 6 | 450853117233000 | TRAIL CR NR MINAM, OR |
| 7 | 451230117293500 | LAST CHANCE CR NR MINAM, OR |
| 8 | 451621117320000 | N MINAM R NR MINAM, OR |
| 9 | 452358117402200 | LITTLE MINAM R NR MINAM, OR |
| 10 | 453013117410000 | TROUT CR NR MINAM, OR |
| Back to 1173-D Contents |
This page maintained by Nichole Bisceglia.
Last updated August 3, 2000.