
Hydrologic Benchmark Network Stations in the Western U.S. 1963-95 (USGS Circular 1173-D)
To download a printer friendly PDF version of this information click here.
This report details one of the approximately 50 stations in the Hydrologic Benchmark Network (HBN) described in the four-volume U.S. Geological Survey Circular 1173. The suggested citation for the information on this page is:
|
Mast, M.A., and Clow, David W., 2000, Environmental characteristics and water-quality of Hydrologic Benchmark Network stations in the Western United States, U.S. Geological Survey Circular 1173-D, 115 p. |
All of the tables and figures are numbered as they appear in each circular. Use the navigation bar above to view the abstract, introduction and methods for the entire circular, as well as a map and list of all of the HBN sites. Use the table of contents below to view the information on this particular station.
|
Table of Contents |
| 1. Site Characteristics and Land Use |
| 2. Historical Water Quality Data and Time-Series Trends |
| 3. Synoptic Water Quality Data |
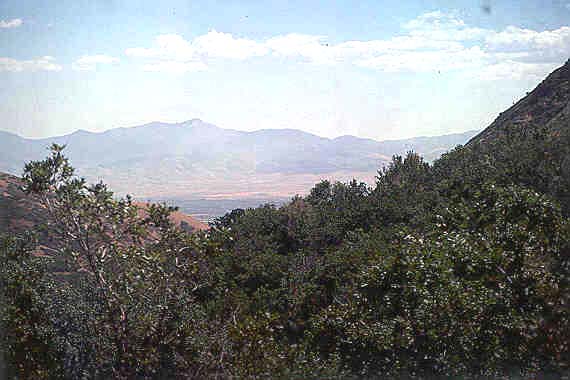
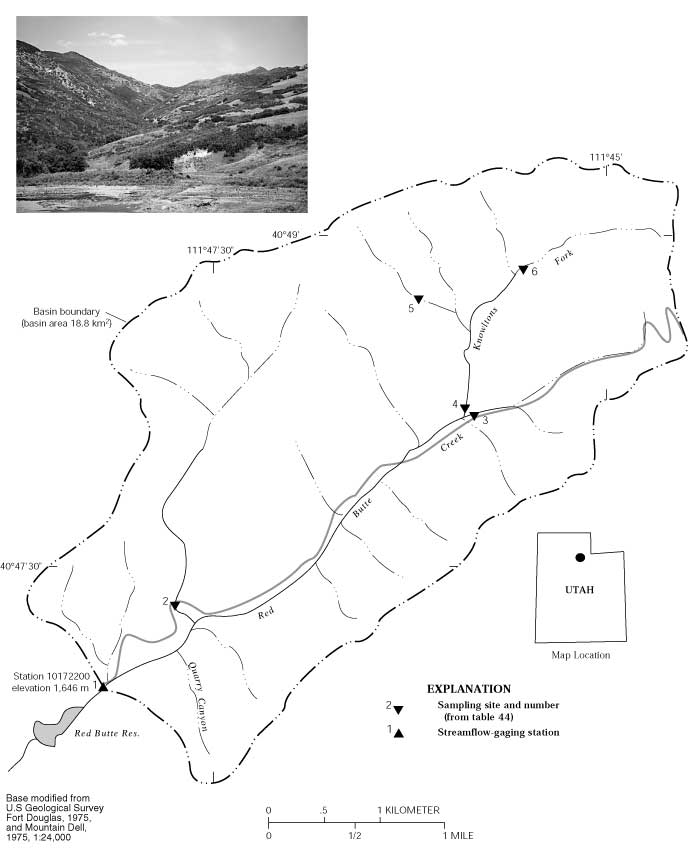
The Red Butte Creek HBN Basin is located in the Middle Rocky Mountains physiographic province in the western foothills of the Wasatch Range in northern Utah (Figure 22. Map showing the study area in the Red Butte Creek Basin and photograph showing the basin landscape). The 18.8-km² basin ranges in elevation from 1,646 to 2,524 m and drains a
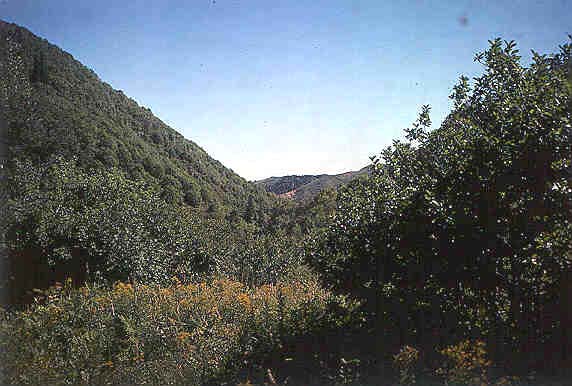 |
The basin is in the Southern Rocky Mountains ecoregion (Bailey and others, 1994) and is dominated by four distinct plant communities-riparian, grass-forb, oak-maple, and coniferous (Ehleringer and others, 1992). Riparian communities consist chiefly of western water birch, mountain alder, and occasional dense stands of red osier dogwood and willow. The grass-forb communities dominate large open areas on south-facing slopes below 1,800 m. The principal grass species is bluebunch wheatgrass; there also are occasional big sagebrush, squawbush, and bitterbrush. Slopes above 1,800 m are dominated by communities of Gambel oak and bigtooth maple that grow in dense thickets along the canyon walls. The coniferous communities grow chiefly on north-facing slopes above 2,000 m and are dominated by pure or mixed stands of Douglas-fir and white fir with some aspen. Soils in the basin are classified as Mollisols and consist of well-drained soils that are formed in colluvium and alluvium derived from mixed sedimentary rocks (Woodward, 1974). There is little profile development, and most soils consist of a layer of dark- to reddish-brown, cobbly silt loam or cobbly loamy sand overlying bedrock. Depth of soils is irregular, varying from 50 cm on south-facing slopes to as much as 150 cm on north-facing slopes. Soils are neutral to moderately alkaline (pH 6.1 to 8.4), and the deeper horizons have 55 to 80 percent coarse fragments that, in the more alkaline soils, are coated with lime (Woodward, 1974).
Bedrock underlying the basin includes southeast-dipping beds of Weber Quartzite of Pennsylvanian age, Park City Formation of Permian age, Thaynes and Ankareh Formations of Triassic age, and Nugget Sandstone and Twin Creek Limestone of Jurassic age that form the north limb of a syncline whose axis trends roughly parallel to Red Butte Canyon (Van Horn and Crittenden, 1987). The Weber Quartzite and Park City Formation crop out in the northern part of the basin and consist of sandy limestone, calcareous sandstone, phosphatic shale, and cross-bedded quartzite. The Thaynes Formation, which crops
 |
The basin drains the northwest part of Salt Lake County in Utah immediately adjacent to Salt Lake City and is within the boundaries of the Red Butte Canyon Research Natural Area, which is administered by the Wasatch National Forest. The goal of the Research Natural Area Program is to protect and preserve a representative array of all important natural ecosystems and to conduct research on ecological processes in these areas (Ehleringer and others, 1992). The history of Red Butte Canyon, which is discussed in detail by Ehleringer and others (1992), is unusual in that it has been protected by the Federal Government for almost a century. Land in the canyon was acquired by the Federal Government between 1888 and 1909 and was used as a water source by the U.S. Army at Fort Douglas until 1991. To protect the watershed and its water quality, the Army closed the basin to logging and grazing in the early 1900's, after which time the only land-use activity was a small sandstone quarry that was operated intermittently by the Army until 1940. In 1969, the U.S. Forest Service acquired the land in the basin and designated it as a research natural area primarily because it is one of the last remaining undisturbed basins in the Great Basin. The canyon also is unique in that it is a relatively pristine watershed adjacent to a major metropolitan area (Ehleringer and others, 1992). Since being acquired by the Forest Service, the basin has remained closed to the public and has been used primarily as a research site for biologists at the University of Utah (URL at http://ecophys.biology.utah.edu/red_butte.html). The only substantial change that has occurred in the basin since the establishment of the HBN station was related to a high discharge in May 1983 that was caused by heavy snows in May followed by unusually warm temperatures (Ehleringer and others, 1992). The high flows severely eroded streambanks, destroyed beaver dams, knocked down riparian vegetation, and caused landslides in the canyon. Sediment flow in the creek increased almost 300 times, which resulted in the formation of a delta at the mouth of Red Butte Reservoir immediately downstream from the HBN station.
The data set for the Red Butte Creek HBN station analyzed for this report includes 262 water-quality samples that were collected from October 1964 through September 1995. Samples were collected about monthly from 1965 to 1982 and quarterly from 1983 to 1995. Water-quality samples from the early part of the period of record were analyzed at a USGS
 |
Calculated ion balances for 236 samples that have complete major-ion analyses are shown in figures 23a and 23b. Graphs showing temporal variation of discharge, field pH, major-ion concentrations, and ion balance in Red Butte Creek, Utah. Ion balances ranged from -13 to +17 percent, and 95 percent of samples had values in the ±5-percent range, indicating that the analytical measurements were of high quality. The average charge balance for all samples was 0.3 percent, indicating that unmeasured constituents, such as organic anions, did not contribute substantially to the ion balance of stream water at this HBN station. Time-series plots of the major constituents were inspected for evidence of method-related effects (fig. 23). The only notable patterns were a few high potassium concentrations in the 1970's and a slight increase in the calculated ion balance in the latter part of the record. The high sulfate concentrations near the end of the period of record probably are related to an extended drought in the region that occurred from 1987 to 1992 (National Climatic Data Center at URL http://www.ncdc.noaa.gov, accessed 1998) rather than to analytical bias introduced by the turbidimetric technique (Schertz and others, 1994). The stepped pattern in the concentrations of nitrite plus nitrate was caused by changes in the analytical reporting limit for this constituent that occurred in 1982 and again in 1991.
[Concentrations in units of microequivalents per liter, discharge in cubic meters per second, specific conductance in microsiemens per centimeter at 25 degrees Celsius, pH in standard units, and silica in micromoles per liter; n, number of stream samples; VMW, volume-weighted mean; inst., instantaneous; spec. cond., specific conductance; <, less than; --, not reported]
| Parameter | Stream Water | Precipitation VMAa | |||||
| Minimum | First Quartile | Median | Third Quartile | Maximum | n | ||
| Discarge, inst. | 0.0130 | 0.049 | 0.071 | 0.13 | 1.6 | 261 | -- |
| Spec. cond., field | 390 | 560 | 610 | 640 | 750 | 261 | 12 |
| pH, field | 6.7 | 8.1 | 8.3 | 8.4 | 8.7 | 260 | 5.1b |
| Calcium | 2,900 | 3,850 | 4,150 | 4,550 | 5,500 | 262 | 26 |
| Magnesium | 1,150 | 1,980 | 2,140 | 2,220 | 3,210 | 262 | 5.2 |
| Sodium | 39 | 480 | 520 | 570 | 1,170 | 260 | 17 |
| Potassium | 10 | 23 | 26 | 28 | 82 | 242 | .9 |
| Ammonium | <.7 | 1.1 | 2.1 | 3.6 | 31 | 101 | 15 |
| Alkalinity, laboratory | 2,740 | 4,160 | 4,440 | 4,740 | 5,660 | 239 | -- |
| Sulfate | 730 | 1,520 | 2,000 | 2,290 | 4,370 | 262 | 28 |
| Chloride | 230 | 340 | 370 | 390 | 540 | 260 | 8.7 |
| Nitrite plus nitrate | <.7 | 2.1 | 3.6 | 7.1 | 36 | 207 | 19c |
| Silica | 120 | 170 | 180 | 180 | 230 | 262 | -- |
a Values are volume-weighted mean concentrations for 1986-95.
b Laboratory pH.
c Nitrate only.
The median concentrations and ranges of major dissolved constituents in stream water collected at the HBN station and VWM concentrations in wet-only precipitation measured at the Murphy Ridge NADP station are presented in table 41. Precipitation chemistry at the NADP station, which is about 92 km northeast of the HBN station, is dilute and slightly acidic and has a VWM pH of 5.1 for 10 years of record. The predominant cations in precipitation were calcium and sodium, which contributed 36 and 24 percent of the total cation charge, respectively. The predominant anions were sulfate and nitrate, which accounted for 50 and 34 percent of the total anions, respectively. The predominance of strong acid anions in precipitation indicates that precipitation at the NADP station may be affected by industrial emissions of sulfur and nitrogen compounds that cause acid rain.
Stream water in Red Butte Creek is moderately concentrated and strongly buffered; specific conductance ranged from 390 to 750 mS/cm, and alkalinity ranged from 2,740 to 5,660 meq/L (table 41). The major solutes in stream water were calcium and bicarbonate, which accounted for more than 60 percent of the total ionic charge. The predominance of these solutes in stream water is attributed to the weathering of carbonate minerals in the underlying sedimentary rocks. The median chloride and
 |
The solute composition of stream water was further evaluated by analyzing correlations between solutes and stream discharge (table 42). Most weathering-derived solutes had strong inverse correlations with stream discharge, particularly magnesium (rho = -0.777) and sulfate (rho = -0.816). These results are consistent with a hydrologic system where weathering-enriched base flow is diluted by water from shallow or surficial sources during periods of increased discharge, particularly spring snowmelt. For the solutes, the strongest correlations were between the base cations and sulfate, and the weakest correlations were with silica concentrations. The strong correlation between sulfate and calcium is consistent with the weathering stoichiometry of gypsum or anhydrite in evaporite beds within the shale. Chloride also was positively correlated with base cations and sulfate, supporting the assumption that most chloride is derived from weathering. Alkalinity was weakly correlated with the major cations, which was somewhat unexpected because of the abundance of carbonate bedrock in the basin.
[Q, discharge; Ca, calcium; Mg, magnesium; Na, sodium; K, potassium; Alk, alkalinity; SO4, sulfate; Cl, chloride; Si, silica]
|
|
|
|
|
|
|
|
|
|
|
| pH | 0.018 | -- | -- | -- | -- | -- | -- | -- | -- |
| Ca | -.563 | 0.132 | -- | -- | -- | -- | -- | -- | -- |
| Mg | -.777 | -.213 | 0.494 | -- | -- | -- | -- | -- | -- |
| Na | -.639 | .040 | .512 | 0.619 | -- | -- | -- | -- | -- |
| K | -.147 | -.050 | .233 | .144 | 0.323 | -- | -- | -- | -- |
| Alk | -.163 | -.193 | .424 | .391 | .171 | 0.163 | -- | -- | -- |
| SO4 | -.816 | .100 | .788 | .659 | .657 | .162 | 0.171 | -- | -- |
| Cl | -.474 | -.098 | .551 | .559 | .514 | .251 | .266 | 0.573 | -- |
| Si | -.272 | -.139 | .010 | .307 | .274 | .242 | .046 | .051 | 0.062 |
[Trends in units of microequivalents per liter per year, except for discharge in cubic meters per second per year, pH in standard units per year, aluminum, iron, and silica in micromoles per liter per year; <, less than; --, not calculated]
| Parameter |
Unadjusted
|
Flow adjusted
|
||
|
Trend
|
p-value
|
Trend
|
p-value
|
|
| Discharge |
-0.001
|
0.045
|
--
|
--
|
| pH, field |
.02
|
.001
|
(a)
|
--
|
| Calcium |
19.2
|
.001
|
15.0
|
0.001
|
| Magnesium |
<.1
|
.084
|
-6.6
|
.001
|
| Sodium |
<.1
|
.001
|
1.2
|
.021
|
| Potassium |
<.1
|
.269
|
(a)
|
--
|
|
Alkalinity, laboratory
|
-12.8
|
.004
|
-13.7
|
.002
|
| Sulfate |
16.1
|
.001
|
11.8
|
.001
|
| Chloride |
<.1
|
.659
|
-.4
|
.539
|
| Nitrite plus nitrate |
(b)
|
--
|
--
|
--
|
| Silica |
<.1
|
.543
|
-.2
|
.073
|
a Flow model not significant at a = 0.10.
b Insufficient data to calculate trend.
The results of the seasonal Kendall test for trends in discharge and major dissolved constituents are listed in table 43. Statistically significant trends were detected in field pH and unadjusted calcium, sodium, alkalinity, and sulfate concentrations at the 0.01 probability level. The trend in flow-adjusted pH was not calculated because the flow model was not statistically significant at the 0.10 probability level. Trends were similar for the unadjusted and flow-adjusted calcium, alkalinity, and sulfate concentrations, indicating that they probably were not caused by variations in stream discharge. The trend in sodium was not statistically significant using the flow-adjusted concentrations; however, the flow-adjusted magnesium concentrations showed a significant downward trend that was not detected in the unadjusted concentrations. The similarity in the timing and magnitude of the trends as shown by the LOWESS curves in figure 23 indicates that stream-water trends at this HBN station may have been related to a similar environmental factor. The trends probably were not caused by changes in atmospheric deposition based on the dilute chemistry of precipitation at the nearby NADP station compared to stream-water chemistry at the HBN station. Similarly, changes in land use probably were not an important factor because the basin has remained largely undisturbed since the early 1900's (Ehleringer and others, 1992). Assuming that analytical bias also is negligible, perhaps the most plausible explanation for the trends in water quality is climate variability. Although a detailed analysis of climate variability is beyond the scope of this report, climatic records for the Wasatch Mountain region indicate that there was record precipitation from 1982 through 1986 that was followed by an extended period of drought that lasted from about 1987 through 1992 (National Climatic Data Center at URL http://www.ncdc.noaa.gov, accessed 1998).
Chemical results of the surface-water synoptic sampling of August 9, 1991, are listed in table 44, and locations of sampling sites are shown in figure 22. During the synoptic sampling, discharge at the HBN station was 0.03 m³/s compared to the median daily discharge of 0.09 m³/s for July (Lawrence, 1987), indicating that the basin was sampled during low-flow conditions for that time of year. Most of the solute concentrations measured at the HBN station (site 1) during the synoptic sampling were between the first-quartile and median values that were reported for the station during the entire period of record, except for sulfate and chloride concentrations, which were lower (table 41). The upstream sampling sites were similar in composition to stream water at site 1, with calcium and magnesium the predominant cations and bicarbonate and sulfate the predominant anions. Ion balances for all but one synoptic samples were positive, ranging from -1.1 to 6.1 percent. This result was somewhat unexpected on the basis of high solute concentrations of the samples and may indicate a bias in one of the analytical measurements. The results in table 44 indicate that concentrations of the major solutes did not vary markedly among the sampling sites, probably because of the abundance of limestone bedrock. For example, calcium concentrations ranged from 3,800 to 4,350 meq/L, magnesium ranged from 1,520 to 2,480 meq/L, and alkalinity ranged from 3,560 to 4,960 meq/L. Sulfate and sodium had a slightly wider range of concentrations than the divalent cations and alkalinity, which may reflect the distribution of different rock types in the basin. For example, the lowest sulfate concentration was measured at site 5, which chiefly drains quartzite and limestone of the Weber Quartzite, whereas the highest concentration was measured in the lowest part of the canyon (site 1), which is underlain by shales, siltstones, sandstones, and some evaporites belonging to the Ankareh Formation. Sodium also seemed to be slightly higher at sites draining shales (sites 1-3) compared to sites primarily draining quartzite and limestone (sites 4-6). In contrast to sulfate, calcium and alkalinity concentrations were lower at the HBN station (site 1) compared to most of the upstream sampling sites, perhaps also reflecting variations in geology. Nitrate concentrations at all of the sampling sites were less than the analytical reporting limit of 3.6 meq/L, which is consistent with the minimal amount of land use in the basin.
[Site locations shown in fig. 22; Q, discharge in cubic meters per second; SC, specific conductance in microsiemens per centimeter at 25 degrees Celsius; pH in standard units; Ca, calcium; Mg, magnesium; Na, sodium; K, potassium: Alk, alkalinity; SO4, sulfate; Cl, chloride; NO3, nitrate; Si, silica; concentrations in microequivalents per liter, except silica in micromoles per liter; Fm, Formation; <, less than]
| Site | Station number | Q | SC | pH | Ca | Mg | Na | K | Alk | S04 | Cl | NO3 | Si | Criteriaa | Remarks |
| 1 | 10172200 |
0.031
|
580
|
8.4 |
3,800
|
2,160
|
520
|
24
|
3,560
|
2,060
|
310
|
<3.6
|
180
|
BG
|
Ankareh Fm, Nugget Sandstone |
| 2 | 404716111474500 |
.0076
|
640
|
8.2 |
4,250
|
2,480
|
700
|
23
|
4,760
|
1,420
|
420
|
<3.6
|
200
|
MT, BG
|
Thaynes Fm, Ankareh Fm |
| 3 | 404811111455000 | .0059 | 540 | 8.2 | 3,950 | 1,520 | 570 | 23 | 4,500 | 1,000 | 340 |
<3.6
|
220 |
MT, BG
|
Ankareh Fm |
| 4 | 404812111455400 | .021 | 570 | 8.3 | 4,250 | 2,160 | 320 | 17 | 4,560 | 1,560 | 280 |
<3.6
|
150 |
MT, BG
|
Weber Quartzite, Park City Fm |
| 5 | 404846111461400 | .0011 | 500 | 8.4 | 3,150 | 1,760 | 260 | 19 | 4,520 | 500 | 280 | <3.6 | 130 |
BG
|
Weber Quartzite |
| 6 | 404855111453200 | .0014 | 590 | 8.3 | 4,350 | 2,000 | 260 | 17 | 4,960 | 1,190 | 220 | <3.6 | 160 | BG | Park City Fm |
a Criteria used in selection of sampling sites: BG = bedrock geology, MT = major tributary.
Bailey, R.G., Avers, P.E., King, T., McNab, W.H., eds., 1994, Ecoregions and subregions of the United States with supplementary table of map unit descriptions: Washington, D.C., U.S. Department of Agriculture, Forest Service, scale 1:7,500,000.
Durum, W.H., 1978, Historical profile of quality of water laboratories and activities, 1879-1973: U.S. Geological Survey Open-File Report 78-432, 235 p.
Ehleringer, J.R., Arnow, L.A., Arnow, T., McNulty, I.B., and Negus, N.C., 1992, Red Butte Canyon Research Natural Area-History, flora, geology, climate, and ecology: Great Basin Naturalist, v. 52, no. 2, p. 95-121.
Lawrence, C.L., 1987, Streamflow characteristics at hydrologic benchmark stations: U.S. Geological Survey Circular 941, 123 p.
National Climatic Data Center, 1997, Summary of the day: Boulder, Colorado, EarthInfo Incorporated, CD-ROM.
ReMillard, M.D., Birdwell, G.A., Lockner, T.K., Herbert, L.R., Allen, D.V., Canny, D.D., 1996, Water resources data, Utah, water year 1995: U.S. Geological Survey Water-Data Report UT-95-1, 321 p.
Van Horn, Richard, and Crittenden, M.D., Jr., 1987, Map showing surficial units and bedrock geology of the Fort Douglas quadrangle and parts of the Mountain Dell and Salt Lake City North quadrangles, Davis, Salt Lake, and Morgan Counties, Utah: U.S. Geological Survey Miscellaneous Investigations Series Map I-1762, scale 1:24,000.
Woodward, Lowell, 1974, Soil survey of Salt Lake area, Utah: Washington, U.S. Department of Agriculture Soil Conservation Service, 132 p.
a. U.S. Geological Survey Topographic Maps:
b. Geologic Maps:
c. Soil Surveys:
d. Miscellaneous Maps:
Table B-1. NWIS site-identification numbers and site names for water-quality sampling sites.
|
|
|
|
| 1 | 10172200 | RED BUTTE CR NR SALT LAKE CITY, UT |
| 2 | 404716111474500 | BLACK MTN CR AT HAIRPIN NR SALT LAKE CITY, UT |
| 3 | 404811111455000 | RED BUTTE CR AB KNOWLTONS FK NR SALT LAKE CITY, UT |
| 4 | 404812111455400 | KNOWLTONS FORK NR SALT LAKE CITY, UT |
| 5 | 404846111461400 | WEST FORK KNOWLTONS FORK NR SALT LAKE CITY, UT |
| 6 | 404855111453200 | UPPER KNOWLTONS FORK NR SALT LAKE CITY, UT |
| Back to 1173-D Contents |
This page maintained by Nichole Bisceglia.
Last updated August 3, 2000.