Table of contents | Glossary | Geology | Depositional model | Heterogeneity | Diagenetic history | Petroleum geology | 1) East-West porosity slices | 2) North-South porosity slices | 3) Onion views of 3-D images | 4) Horizontal slices of porosity | 5) Horizontal and East-West permeability and porosity slices
The House Creek and Porcupine oil fields are delineated by a major marine-ridge system that is composed of complexly interbedded thin-bedded mudstone and sandstone of the Sussex "B" sandstone. The informally named Sussex "B" sandstone is one of as many as 12 separate sandstone bodies that are located at different vertical and lateral positions within the Sussex Sandstone Member (Anderman, 1976; Crews and others, 1976). Core and outcrop studies were combined with well log and analytical data, plus published research, to assign depositional environments for the Sussex "B" sandstone. Sandstones and mudstones were mapped across the study area to evaluate scales, types, and timing of reservoir heterogeneities, including lateral and vertical continuity and extent of bedforms, interbedding of reservoir and non-reservoir (seal) units, and depositional changes across the field related to variations in facies thickness, depth, and distribution of permeability boundaries.
The "B" sandstone was deposited in a probable mid-shelf position in the Cretaceous Epicontinental seaway. Four separate sand ridges comprise the "B" sandstone in the field area. Transgression during deposition created westward (landward) backstepping of later deposited sand ridges. Sand-ridge development began in the southeastern corner of the field and progressed to the northwest, based on stacking patterns and correlation of sand-ridges and contained mudstone-sandstone beds, Sussex "B" upper and basal disconformities, and the overlying Ardmore bentonite.
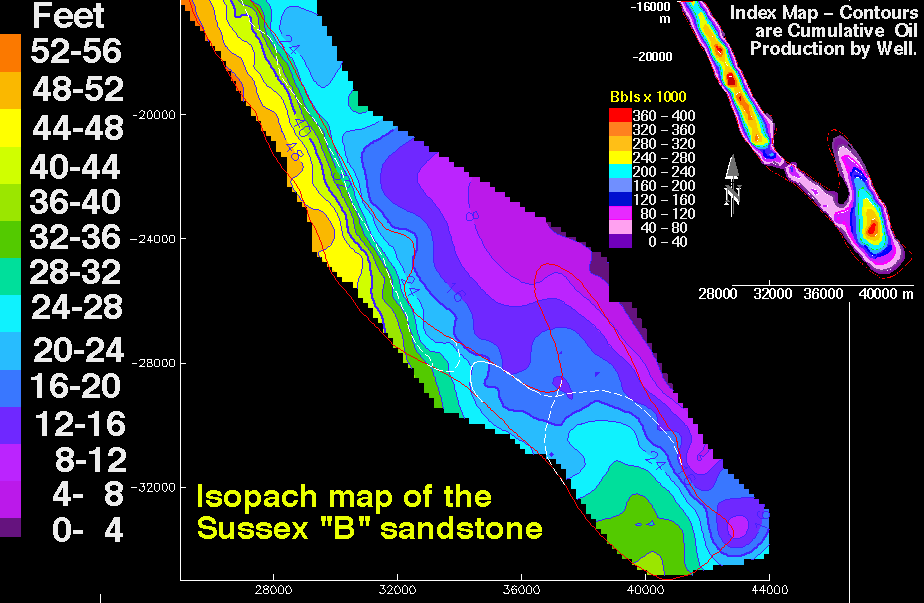
Figure 6 shows thickness (in feet) of the Sussex "B" interval between the upper and basal disconformities. Landward stacking of sandstones is evident from the westward increase in sediment thickness. When mapped using either the overlying Ardmore bentonite or the bounding disconformities as datums, the Sussex "B" sandstone is wedge-shaped. The Cody Shale interval between the bentonite and "B" sandstone also is wedge-shaped; however, the open end is toward the ocean. The bentonite is a time-equivalent layer of volcanic ash that was chemically altered to clays during burial. While this trend is clear within the House Creek and Porcupine fields, each reservoir must be evaluated separately for stacking patterns. The top of the Sussex "B" reservoir sandstone in the study area is located approximately 20 to 60 ft (6 to 18 m) below the Ardmore bentonite, based on correlation of well-logs and core studies (Higley, 1994). Variation in thickness of the Ardmore-Sussex "B" interval results from 1) influence of depositional environment, depositional energy, and sediment supply on localization of sediments, 2) greater rates of compaction for shale-rich versus sandstone beds, and 3) local or basinal structural movement and its association with rates of deposition.
Figure 6. Isopach map of the Sussex "B" sandstone showing thickness in feet of the interval between bounding disconformities; contour interval is 4 ft (1.2 m). Map scales are meters. The small index contour map is cumulative oil production; contour interval is 40,000 barrels. The thin red line outlines the boundary of the House Creek field. Thin white lines in the southern half of the field are limits of sand-ridge 1 and overlying sand-ridge 2. The large-scale 64 KB image is named ssxiso.gif .
Based on thin-section, core, outcrop, well-log, and production data, the highest quality Sussex "B" reservoir intervals are fine- to medium-grained, glauconitic, thinly bedded, trough- and planar cross-bedded sandstones. These facies contain greater reserves, porosity, and permeability and exhibit fewer laterally continuous permeability barriers and baffles than the fine-grained massive, ripple-laminated, and wavy-bedded sandstones that also produce oil.
Transport of shoreface and shelf sediments across this seaway resulted from complex interaction of oscillatory and unidirectional currents, created primarily by intermittent along-shelf, southerly storm flows (Gaynor, 1991). Sandstone ridges are aligned obliquely to the prevailing transport direction, as is shown on figure 7. Figure 8 is an idealized vertical slice across three stacked sand ridges. Due to the great spatial scales (width and length) of Shannon and Sussex sand ridges, the ridges must be obliquely oriented with respect to fluid flows (Gaynor and Swift, 1988), as opposed to the flows being perpendicular to ridge boundaries. Cross-ridge flow accelerates on the up-current flank of the ridge; consequently, it is the up-current flank that undergoes erosion (Gaynor and Swift, 1988). This cross-ridge acceleration and down-ridge frictional deceleration results in a rotation of flow over the ridge that causes erosion of the up-current flank, aggradation of the crest of the ridge, and growth of the sand ridge (Gaynor and Swift, 1988).
This model also explains thinning of the Sussex "B" sand ridges proximal to the open ocean, aggradation of the reservoir intervals along the crests of the sand ridges, and decrease in grain size, sorting efficiency, and associated porosity and permeability of sandstones west of axes of individual sand ridges and for the entire "B" sandstone. Directions of maximum fluid flow for this sand-ridge model are parallel to the axes of each trough-cross-bedded bedform and also parallel to field axes. These flow directions result from depositional patterns of the trough-cross-bedded sandstones, and concentration along field axes of the thickest and most porous and permeable units.
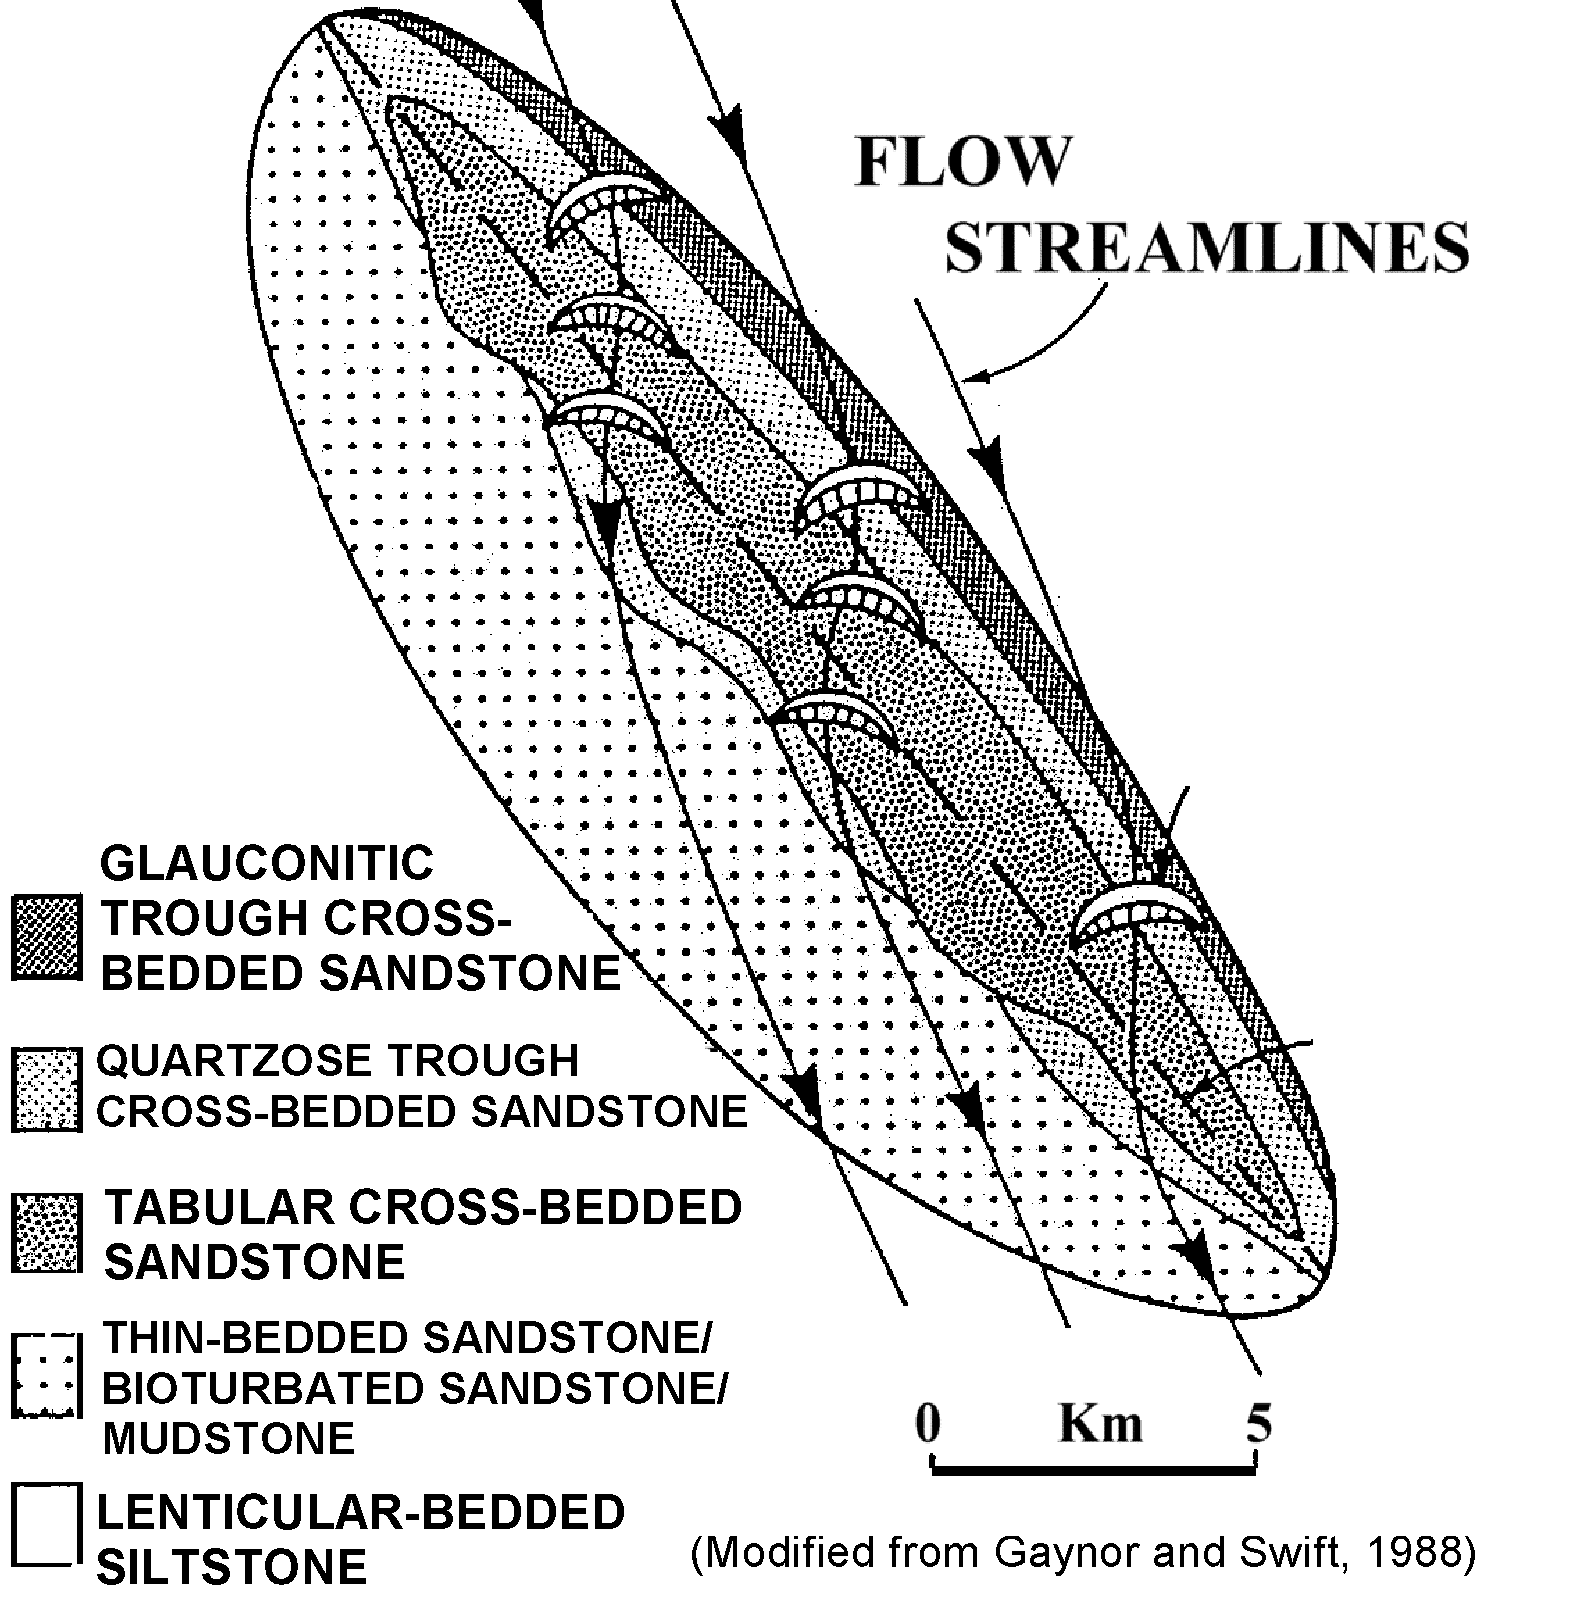
Figure 7. Plan view of lithofacies distribution on a sand ridge, and generalized flow streamlines (srplanvs.gif). Flow streamline arrows are the directions of currents over the sand ridge. Scale is approximate. Click sand Ridge - plan view (modified from Gaynor and Swift, 1988, reprinted by permission) to see the detailed (srplanvw.gif) image (208 KB).
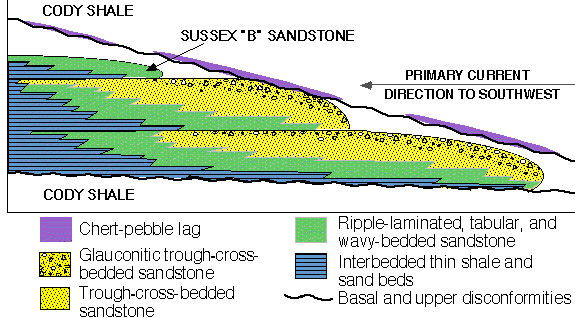
Figure 8. Idealized east-west-oriented vertical section across three stacked sand ridges (ssxflowu.gif). General facies types are listed. No vertical or horizontal scales.
Figure 8 shows upward and seaward increase in depositional energy (yellow dotted and green areas), which is tied to increases in porosity and permeability. The basal disconformity (wavy line) is the horizontal datum for the 3-D porosity and permeability models. The wedge shape of the Sussex "B" interval results from reworking by currents of seaward margins of sand ridges, and landward redeposition of sediment. The blue-lined areas are basal and landward low-depositional-energy facies; these exhibit low porosity, permeability, and petroleum production.
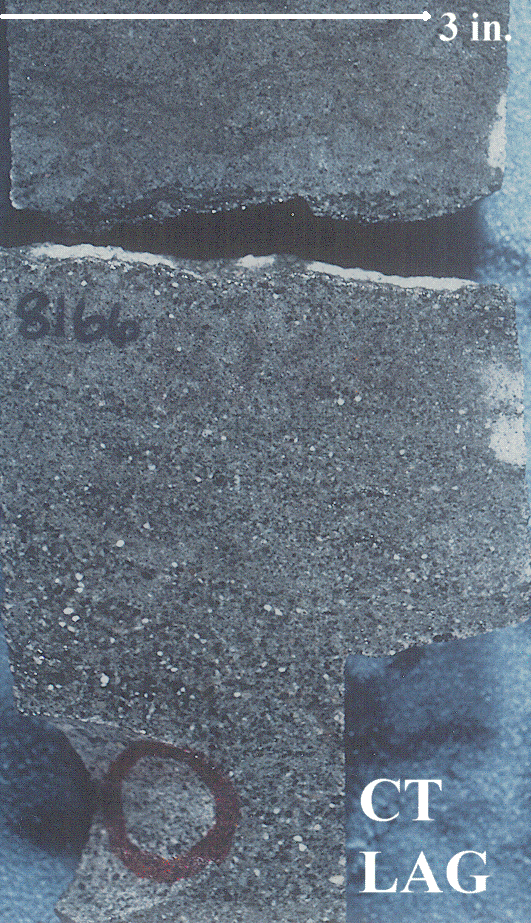
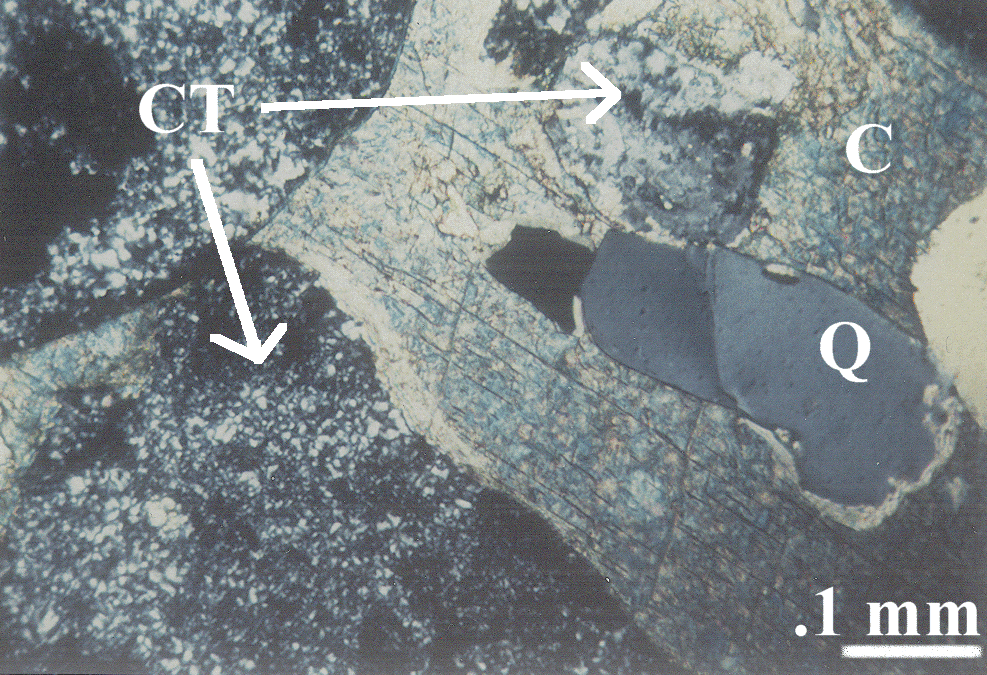
The disconformity at the top of the Sussex "B" sandstone is generally marked by a thin chert-pebble sandstone (figure 9A). Shading variation of the quartz (figure 9B) results from fracturing of the grain in this cross-nicols photomicrograph view (light is transmitted differently due to rotation of the crystal axes). Quartz grains that were incorporated from underlying sand-ridge sediments commonly exhibit early stages of diagenesis within marine environments, primarily chamosite overgrowths under the quartz overgrowths. Grain-to-grain contacts within this facies are mainly point with lesser long-straight contacts.
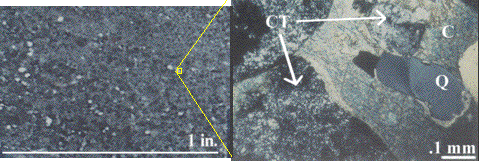
Figure 9. A. Chert-pebble-lag core photograph, and B. crossed-nicols photomicrograph of a chert-pebble lag, No. 14-9 Federal well. Chert pebble lag core links the detailed (576 KB) ctlagc.gif core image. The bimodal grain distribution (mix of large and small grains) is visible on both images. Chert pebble thin section shows the large-scale (736 KB) ctlagts.gif photomicrograph image. Labels are Q quartz, CT chert, and C calcite. Quartz grains incorporated from underlying central-ridge facies sandstones commonly "float" in a matrix of (blue stained) ferroan carbonate cement.
Figures 10, 11, and 12 are thin-section, outcrop, and core photographs of trough-cross-bedded sandstones. These sandstones are the primary reservoir facies; facies are further divided based on relative decrease in depositional energy into central ridge, high-energy ridge margin, and low-energy-ridge margin (Tillman and others, 1985).
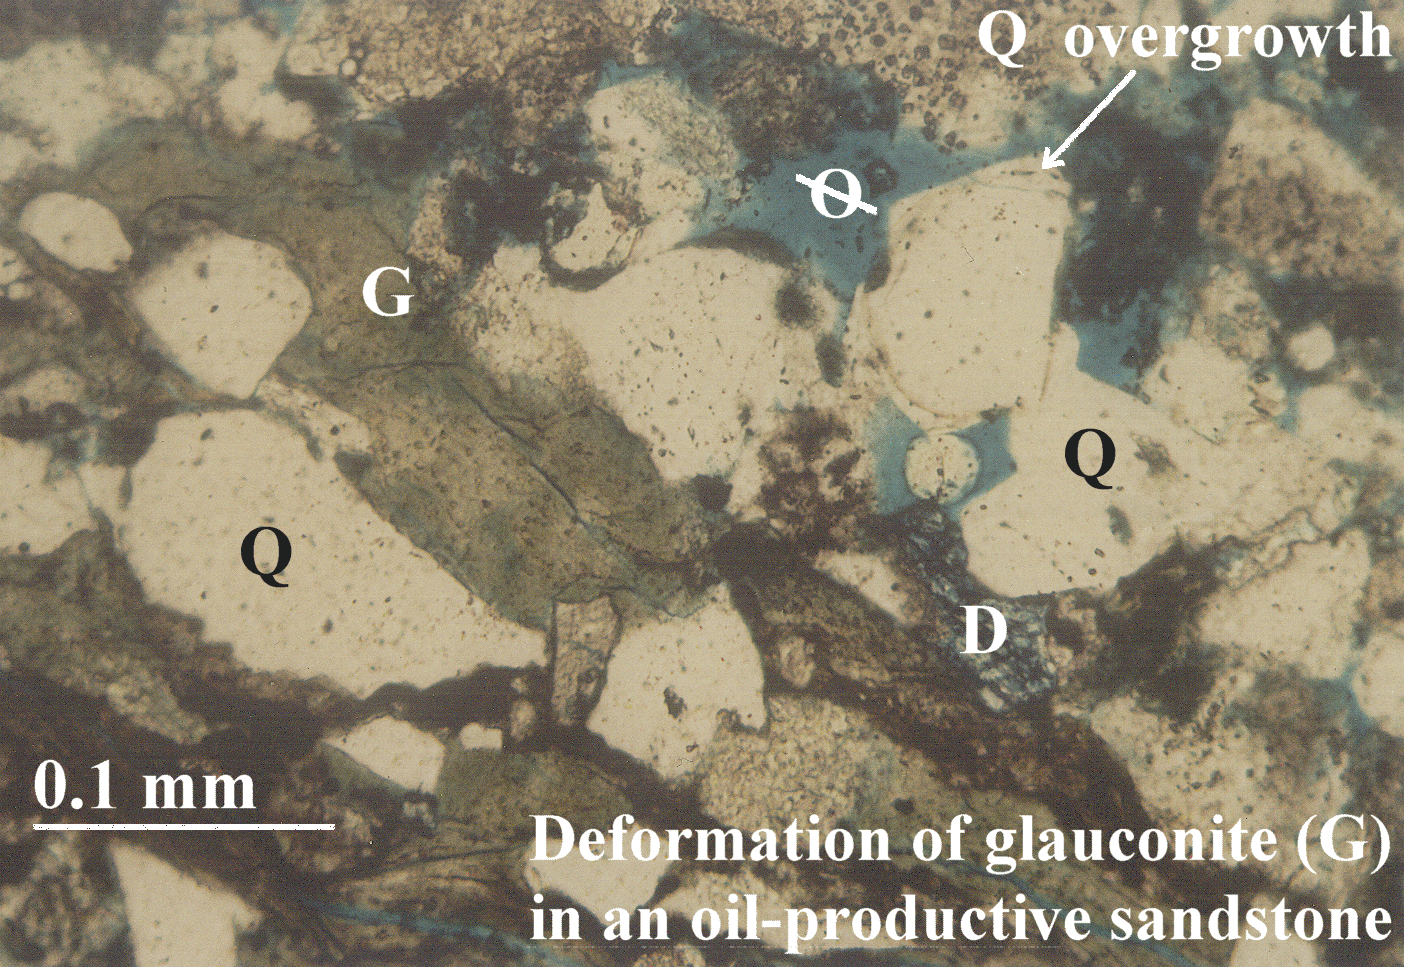
Figure 10. This transmitted-light thin-section image is from 8,014 ft (2,443 m) depth in the Empire-Federal "C" oil well. Deformation of glauconite (G) pellets and other soft sediments in trough-cross-bedded sandstones form microscopic and macroscopic permeability baffles to fluid flow. Note also that quartz (Q) grains surrounded by glauconite do not exhibit the later diagenetic quartz cementation. Mudstone (brown) and glauconite (green) are concentrated along the lower depositional energy laminae of trough-cross-bedded sandstones. Late-diagenetic dolomite cement is stained dark blue (D). Medium-blue epoxy fills pore spaces (ellipse with a line through it). Glauconite is 1.4 MB thin section (glauts.gif) image.

Figure 11. Photograph of an outcrop of Sussex Sandstone Member low-energy-ridge-margin (LRM) sandstone; outcrop is located in NW. corner of sec. 7, T. 40 N., R. 78 W., Natrona Co., Wyoming. LRM thickness is about 1 ft (0.5 m). Greater dispersal of glauconite, clays, and mud in lower depositional energy facies decreases porosity and permeability. This thin trough-cross-bedded sandstone, and the bounding burrowed and bioturbated sandstone/mudstone facies, contain mudstone and glauconite laminae and beds that are preferentially eroded, causing greater relief. Blue and purple lines in this small-scale image separate bedding planes. Trough-cross-bedded sandstone 1 MB (ssxcrp2.gif) outcrop image.
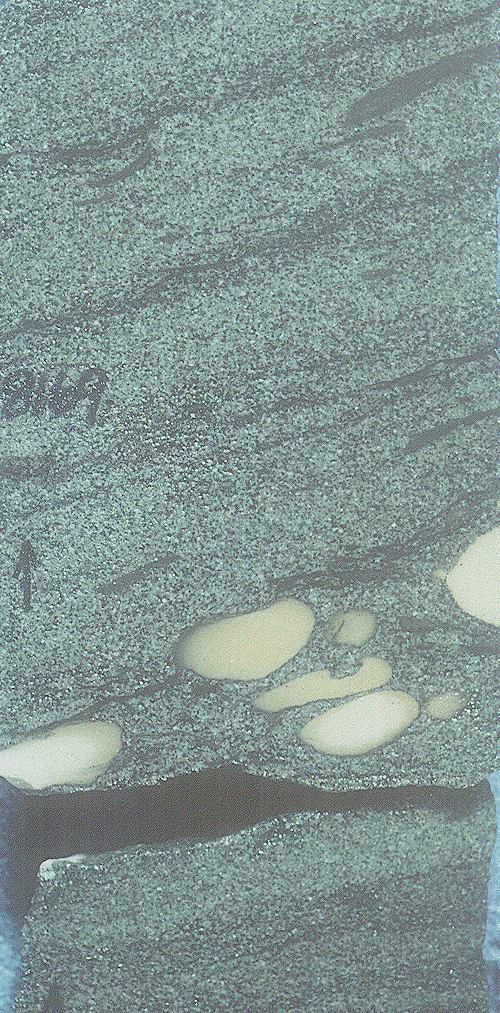
Figure 12. Core photograph of trough-cross-bedded medium-grained sandstone from 8,169-ft depth in the No. 1 Mandel-Federal well. Depths are in feet. Arrow points up. Siderite (S) clasts are concentrated on the bedding planes. Trough-cross-bedded sandstone 512 KB (trs8169.gif) core image.
Figures 13 and 14 show inter-ridge depositional environments that consist mainly of burrowed and intact mudstone laminae, and interbedding of mudstone with fine-grained sandstone. Abundant permeability barriers result in low levels of petroleum production. These facies, concentrated toward the base of sand ridges, compartmentalize the reservoir intervals.
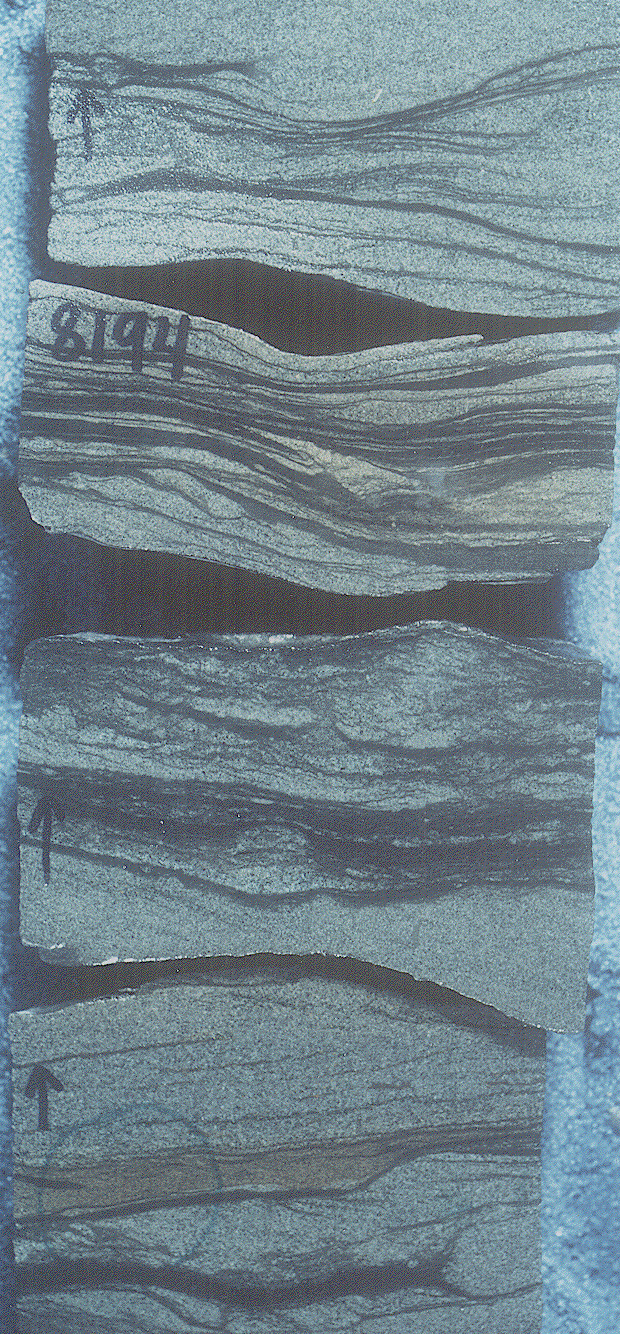
Figure 13. Core photograph of wavy-bedded fine-grained sandstone from 8,194-ft depth in the No. 1 Mandel-Federal well. Dark lines are mudstone laminae that segregate the thin, discontinuous sandstone beds. A siderite drape (arrow) is located on a ripple reactivation surface. Core width is 3.5 inches (9 cm). Arrows within core point up-hole. Wavy-bedded sandstone - 688 KB core (wss8194.gif) image.
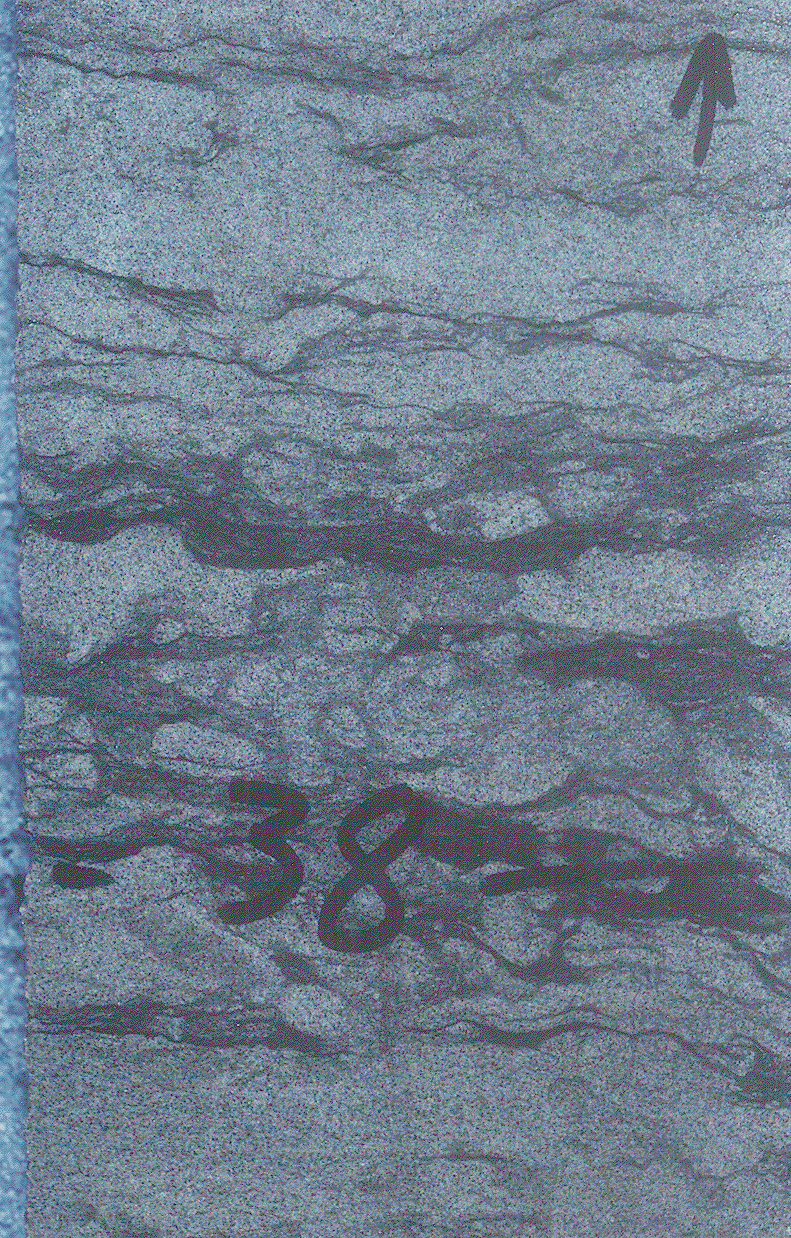
Figure 14. Core photograph of a bioturbated very fine grained sandstone from 8,038-ft depth in the No. 1 Empire Federal well. This facies exhibits very low porosity and low permeability and is a reservoir seal. Black arrow points to a mudstone lamina. Gold arrow shows a burrow trace. Core width is 2 inches. Bioturbated siltstone - 800 KB core (bss8038.gif) image.