
|
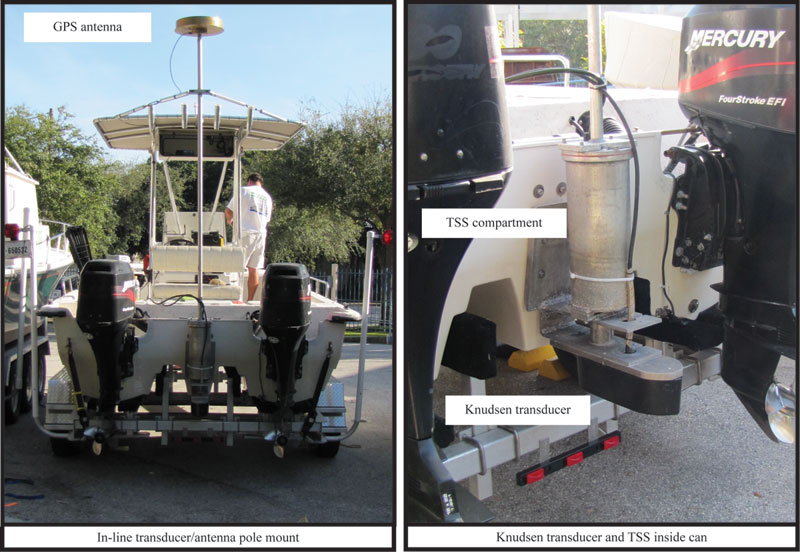
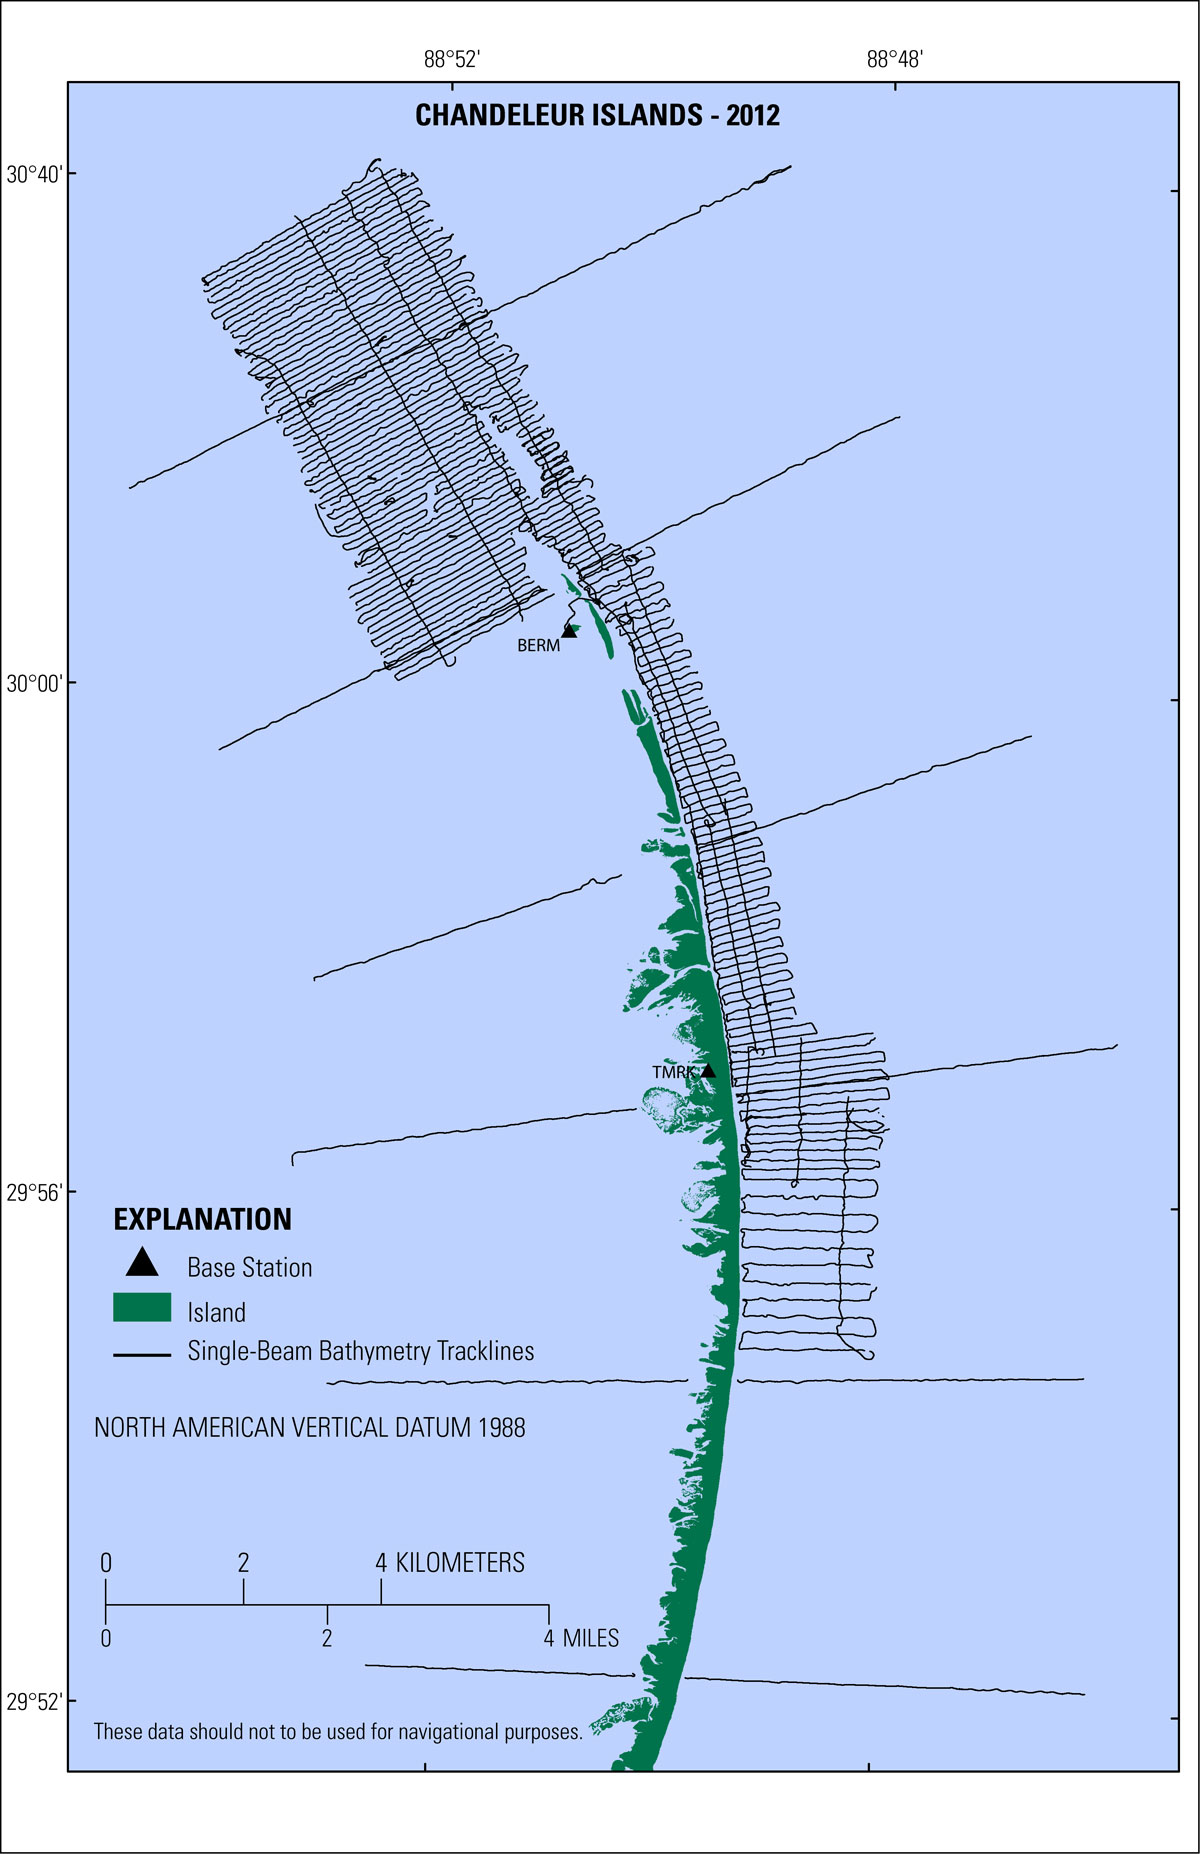
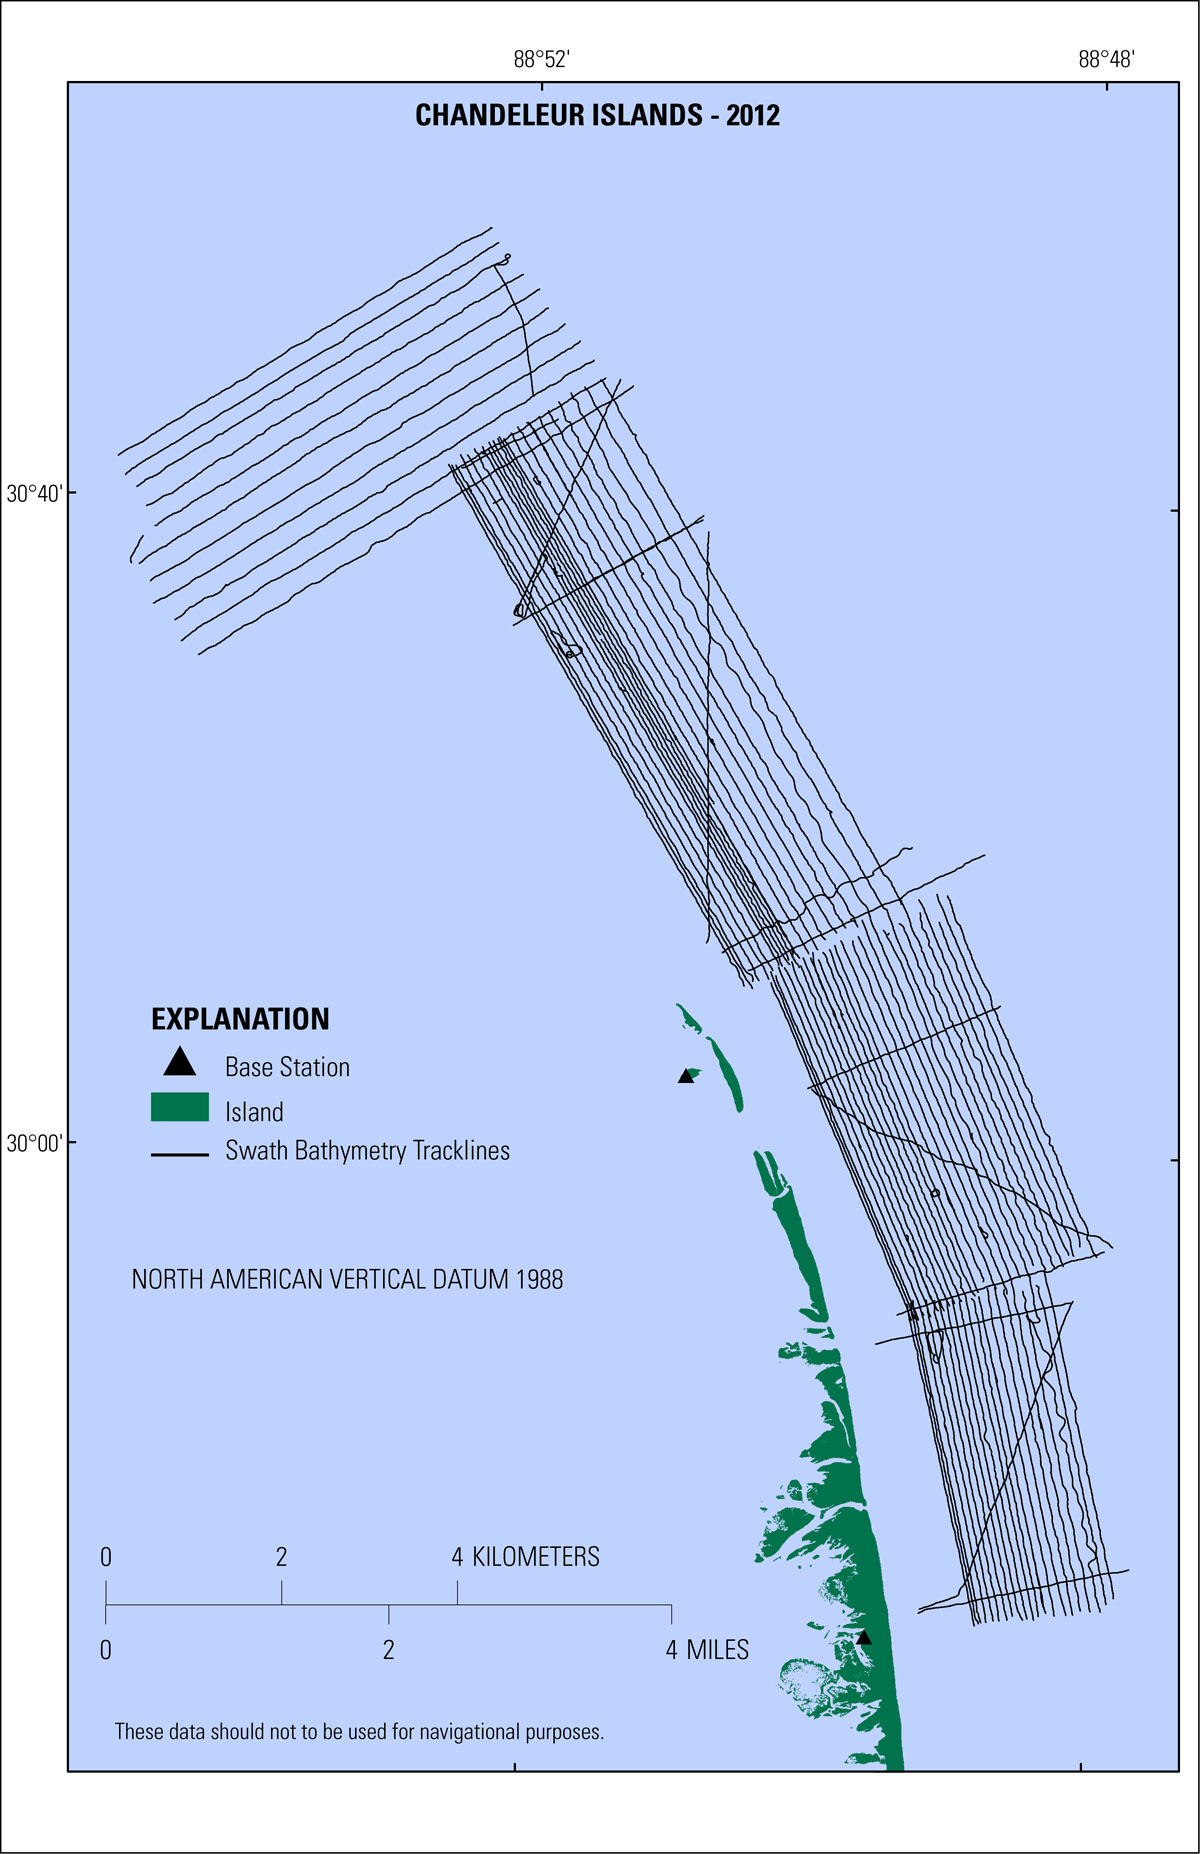
Survey Overview and Data AcquisitionGeophysical survey data were collected during concurrent cruises from July 20 to August 3, 2012, covering an area of approximately 80 square kilometers (km2). Single-beam data (12BIM04) were collected aboard the 22-foot (ft) RV Twin Vee (fig. 2), from which 495 line-km of bathymetry data were collected. Tracklines (248 lines) were primarily oriented perpendicular to shore and spaced approximately 100 meters (m) apart (fig. 3). Additional single-beam data were also acquired along six long-term change lines spaced approximately 1 km apart extending 6 km offshore on both the gulf and sound sides of the islands. These lines were designed to reoccupy previously collected single-beam bathymetric survey lines, allowing for comparison of bathymetric profiles from multiple surveys independent of larger-scale mapping efforts. Interferometric swath and seismic data (12BIM03) were collected from the 26-ft RV Survey Cat (fig. 4). A total of 458 line-km of data were collected utilizing an integrated suite of geophysical instruments capable of mapping the nearshore environment around the island, including an interferometer that provided swath bathymetry with backscatter (this report) and a high-resolution chirp subbottom profiler that imaged the shallow subbottom (Forde and others, 2013). Swath bathymetry, backscatter, and chirp tracklines (124 lines) were generally shoreline parallel, and line spacing varied from 50 m to 250 m, depending on water depth (fig. 5). Tie lines, or tracklines perpendicular or oblique to shoreline orientation, were also surveyed as a check on bathymetric soundings and to provide dip or apparent dip lines for the chirp profiles. The North American Vertical Datum of 1988 (NAVD88) orthometric elevation range for all of the bathymetric data was -0.42 m to -15.42 m, derived from the National Geodetic Survey's (NGS) geoid model of 2009 (GEOID09). Single-Beam Bathymetry | Swath Bathymetry Single-Beam BathymetryNavigationThe Global Positioning System (GPS) base station was assembled at a previously installed USGS benchmark identified (TMRK), located on a wide sand flat on the sound side of the island. A second base station was erected on a temporarily installed benchmark (BERM), approximately 6.5 km north of TMRK on an emergent island remnant (fig. 3) in order to reduce the Differential Global Positioning System (DGPS) baseline length between the base station and rover GPS in the northern portion of the survey area. The Ashtech Z-Xtreme GPS receivers (table 1) recorded the 12-channel full-carrier-phase positioning signals (L1/L2) from satellites via a Thales choke-ring antenna. A similar GPS instrument combination was duplicated on the survey vessel (rover). The base receivers and the rover receiver recorded their positions concurrently at 1-second (s) intervals throughout the survey. HYPACK version 10, a marine surveying, positioning, and navigation software package, managed the planned-transect information and provided real-time navigation and instrumentation-status information to the boat operator. Soundings and MotionAboard the RV Twin Vee, depth soundings were acquired at 50-millisecond (ms) intervals using a Knudsen 320BP echosounder system with a 200 kilohertz (kHz) transducer (fig. 2) (table 2). Boat motion was recorded at 50-ms intervals using a Teledyne TSS Dynamic Motion Sensor (TSS DMS-05) (table 3). Data from the GPS receiver, motion sensor, and fathometer were recorded in real-time and merged into a single raw data file (.raw) in HYPACK, with each device string referenced by a device identification code and time stamped to UTC. Sound VelocitySound velocity measurements were collected using an Applied Microsystems Smart Sound Velocity Profiler (SVP). The instrument was periodically cast overboard to observe changes in water column speed of sound (SOS). The recorded daily mean of sound velocity for the duration of the survey was 1532.26 meters/second (m/s).
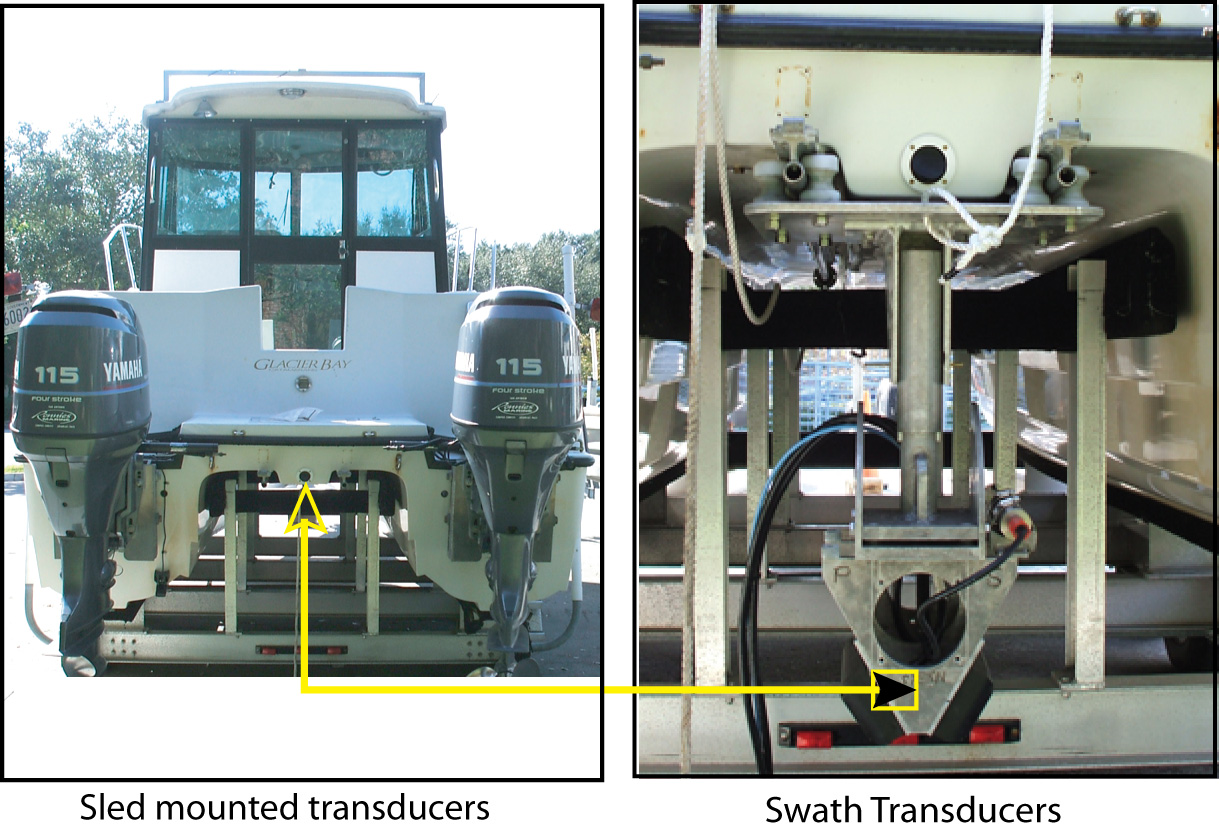
Interferometric Swath Bathymetry and BackscatterNavigation and MotionThe position data string was integrated in real-time using the Coda-Octopus F190R Precision Attitude and Positioning System, which includes a waterproof inertial measurement unit (IMU). The IMU is located between the transducer heads to minimize lever arm geometry errors between the observed depths and associated vessel motion. Real-time corrected positions were acquired from an OmniSTAR HP (High-Precision differential global navigation satellite system) satellite constellation subscription. In addition to the position string, the F190R records heave, roll, and pitch of the vessel during acquisition (table 4), which are used to calculate the precise position of a measured reference point near the head of the transducers. Equipment offsets were entered into the F190 software prior to instrument calibration and survey commencement. Planned survey tracklines were loaded into HYPACK as a navigation guide for the boat operator. Soundings and BackscatterInterferometric swath bathymetry and backscatter data were collected aboard the R/V Survey Cat using a 468 kHz Systems Engineering and Assessment Ltd. (SEA), SWATHplus-H (high frequency) interferometric sonar system (table 5). The transducers were mounted on a sled attached to a rail system fastened between the catamaran hulls, allowing the instrument to align directly below the GPS antennae to minimize geometry calculation errors (fig. 4). OmniSTAR HP position correction data and motion data from the IMU were integrated with interferometric soundings in the SWATHplus software package, with position and calibration offsets pre-defined by a session file (.sxs), allowing for the acquisition of real-time- corrected depths. Prior to deployment, all equipment offsets were surveyed in dry dock with a laser total station. During the survey all swath tracklines were recorded in SEA raw data format (.sxr). Sound VelocityA Valeport Mini Sound Velocity Sensor (SVS) was attached to the transducer mount and collected continuous speed of sound (SOS) measurements at the depth of the transducers. These values were directly read and incorporated into the SWATHplus acquisition software giving real-time SOS at the transducer head while underway (table 6). In addition, a separate Valeport miniSVP sound velocity profiler (SVP) was used to collect SOS profiles; water surface to seafloor; at strategic intervals throughout the survey (table 7). Accurate SOS values throughout the water column are essential to accurate sea floor mapping with a swath system, particularly at swath beam range extents, and most notably at depths greater than 3 meters (m), where SOS has commonly demonstrated variability due to thermoclines and changes in salinity. If SOS is inaccurate, water column refraction will significantly decrease data precision and accuracy throughout the beam range of the swath system, particularly at the far range, thus increasing manual post-survey processing time and interpolation uncertainty upon creation of a digital elevation model (DEM).
Note: to view PDF documents, you will need the latest version of Adobe Reader or similar software. Disclaimer: Any use of trade names is for descriptive purposes only and does not imply endorsement by the U.S. Government. |
|||||||||||||||||||||||||||||||||||||||||||||||||||||||||||||||||||||||||||||||||||||||||||||||||||||||||||||||||||||

![]() U.S. Department of the Interior |
U.S. Geological Survey
U.S. Department of the Interior |
U.S. Geological Survey
URL: http://pubsdata.usgs.gov/pubs/ds/0847/ds847_survey_overview.html
Page Contact Information: GS Pubs Web Contact
Page Last Modified: Monday, 28-Nov-2016 19:29:02 EST