Data Series 877
|
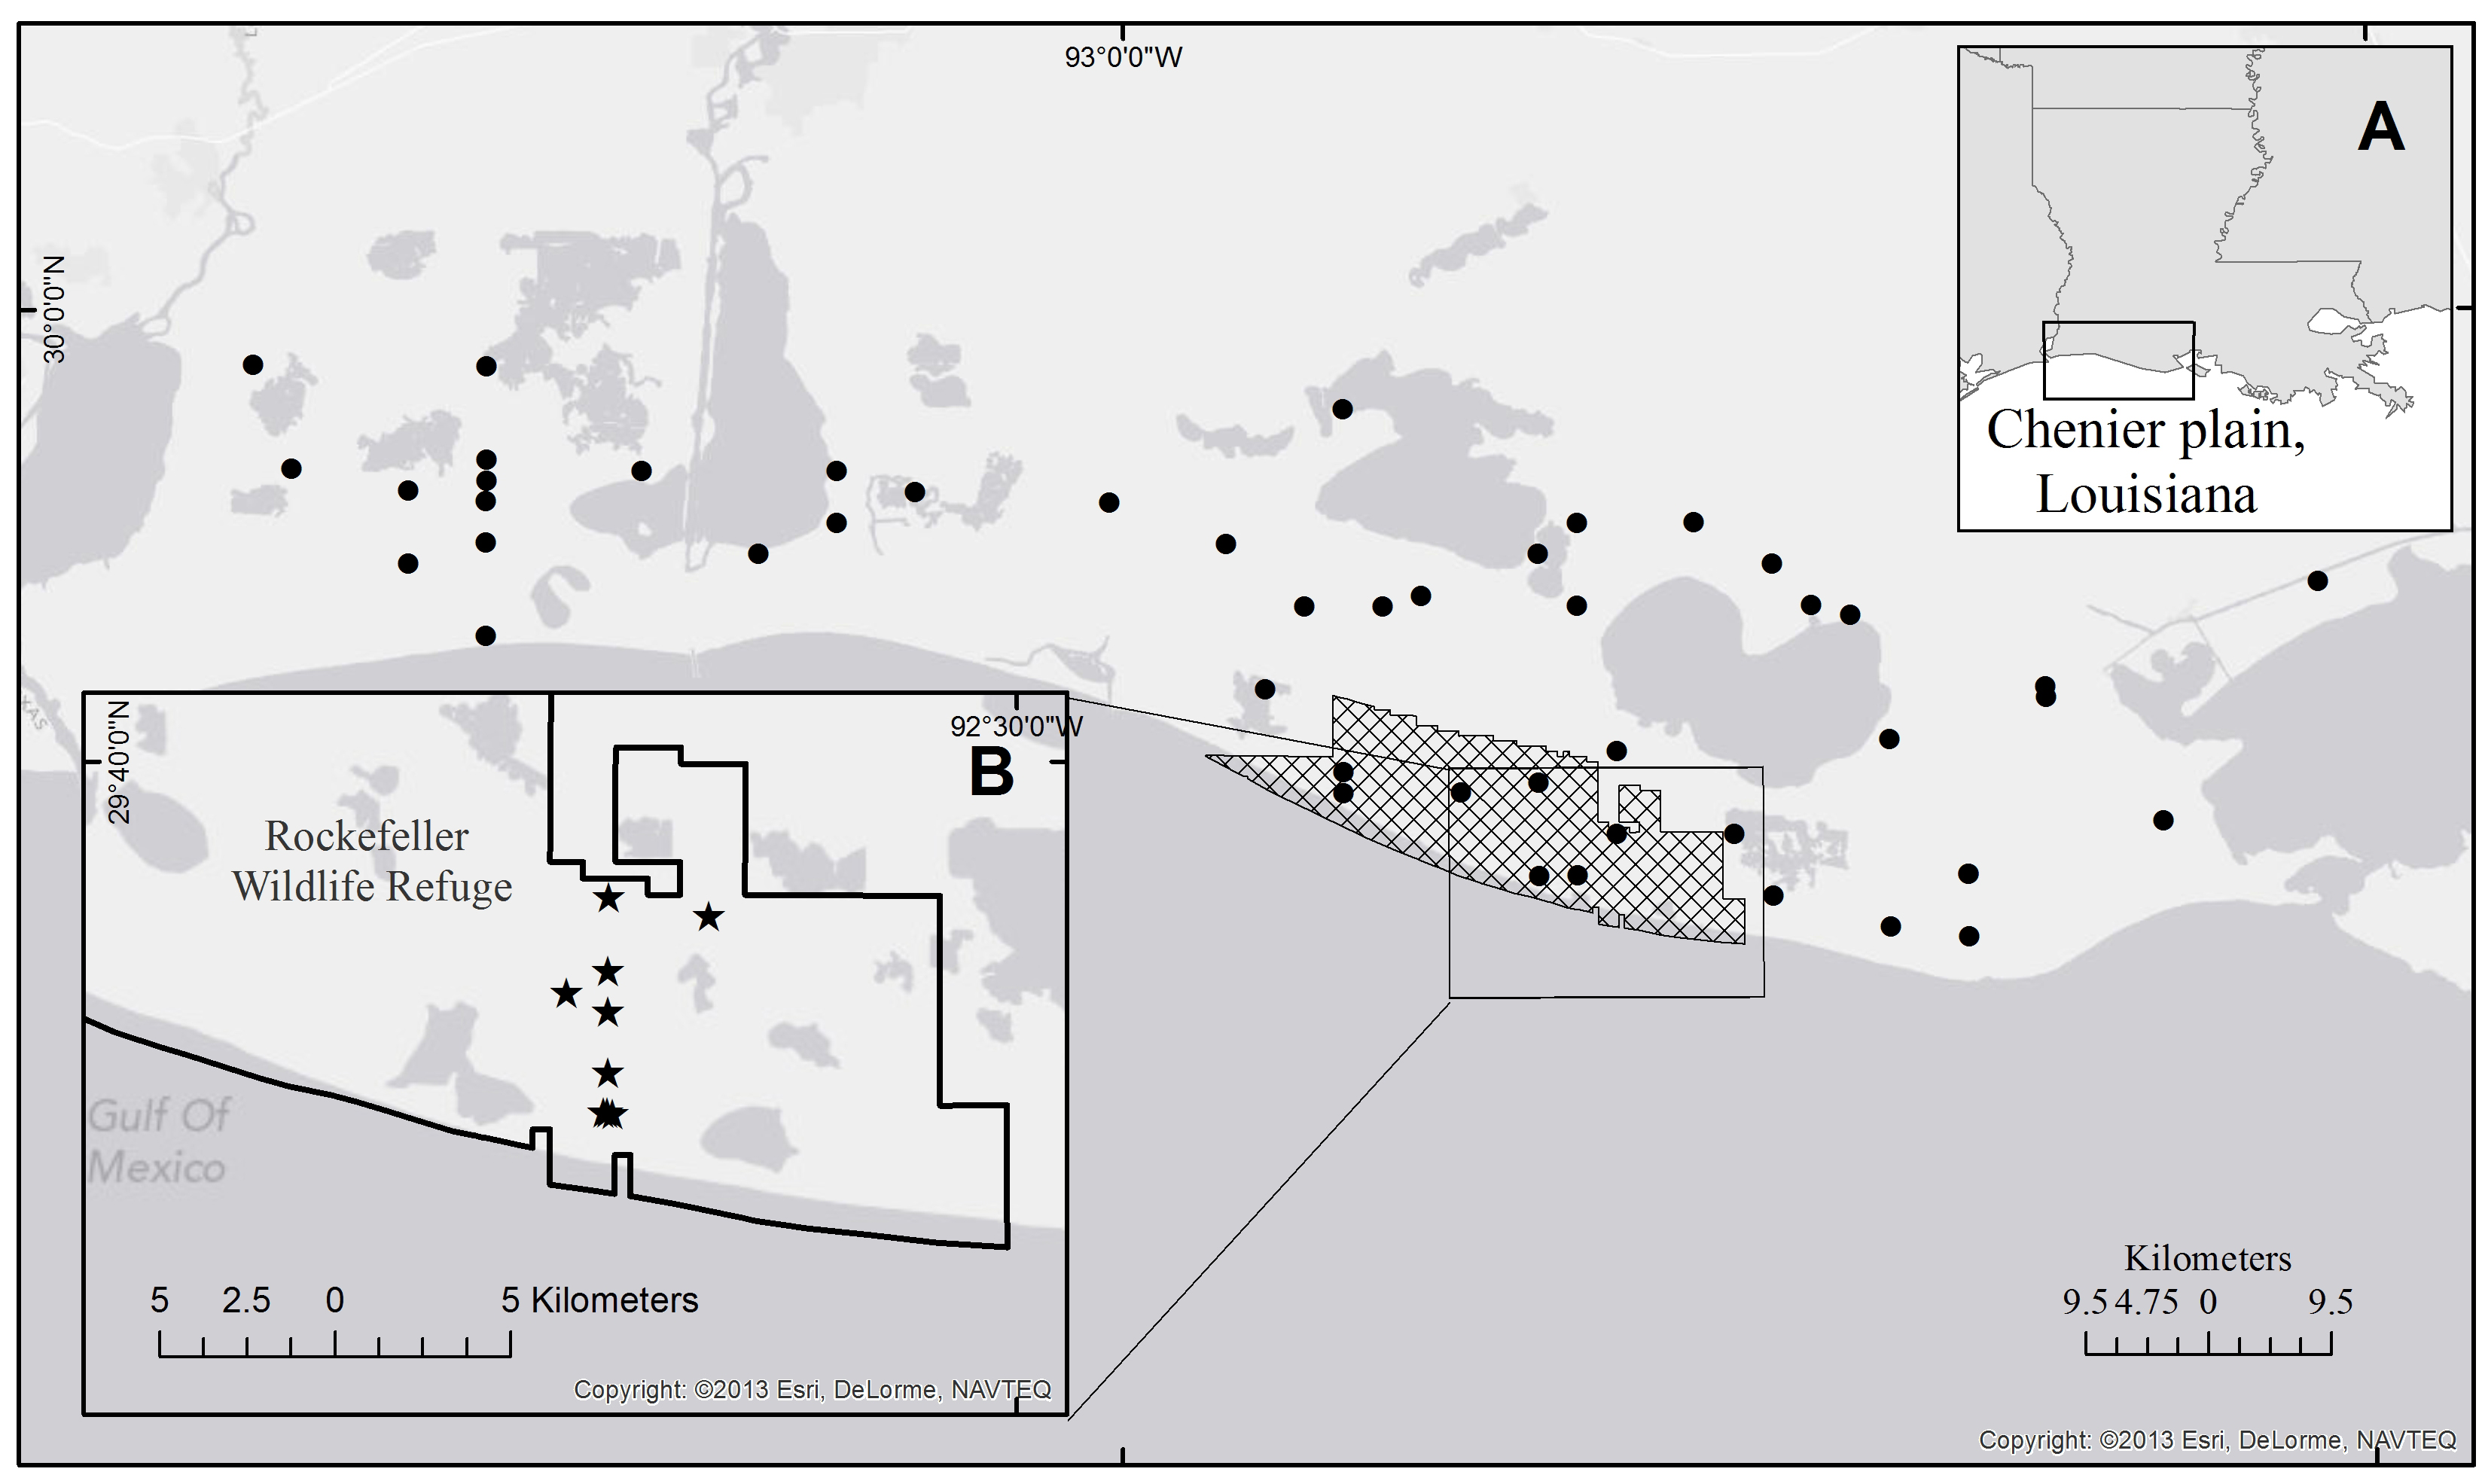
MethodsSampling consisted of 9 sediment cores and 46 surface sediment samples collected from 2009 to 2010 in southwest Louisiana (Figure 1). Cores were collected under Field Activity Number (FAN) 09WCC01 at Rockefeller Wildlife Refuge (RWR) on April 29-30, 2009. RWR is a state-owned refuge managed as a waterfowl and fishery habitat; its primary mission is to promote scientific research (Louisiana Coastal Wetlands Conservation and Restoration Task Force, 2002). Sediment samples were collected at RWR and throughout the Chenier Plain during regularly scheduled CRMS site maintenance from February 1, 2010 to April 1, 2010.
Sediment Core CollectionNine (~50-centimeter (cm) long) cores were collected within intermediate and brackish marsh at RWR aboard an airboat. Five core sites were located along a transect perpendicular to the Gulf of Mexico (GOM) coastline, ranging from 0.5 to 5.75 kilometers (km) from the GOM shoreline (fig. 1 Inset B; USGS Site ID# 09WCC01_04, 06, 07, 08, 09; in order of closest to farthest from shore). To examine small-scale variation, two sites were located 100 meters to the east and west of site 09WCC01_04 and parallel to the shore (09WCC01_03 and 05, respectively). Two additional sites were located to the west and east of the transect (09WCC01_01 and 02, respectively) at sites previously studied by Coastal Protection and Restoration Authority of Louisiana staff. Sediment was extracted by pushing a clear acrylic tube, 10-cm in diameter, into the marsh. The barrel edge was sharpened and vegetation around the extraction site’s perimeter was sliced to reduce compaction during tube insertion. Compaction was estimated by measuring the difference in the marsh elevation between the inside and outside of the barrel top prior to extraction. The tube was capped and extracted from the sediment with a handle constructed of polyvinyl carbonate (PVC). Geographic position, time of day, water depth, and surface water salinity were measured at each site. Porewater salinity adjacent to the core site was measured by driving a narrow, plastic tube to a depth of 10 cm and withdrawing a water sample using suction from an attached syringe (McKee and others, 1988). The water sample was placed in a cup and salinity was measured with a handheld, calibrated YSI conductivity probe. The cores were sealed and transported to the USGS St Petersburg Coastal and Marine Science Center (SPCMSC) lab. The cores were kept cold and vertical during transportation in a 50-gallon barrel that was lined, insulated and filled with ice. At the lab, the cores were X-radiographed (58-64 kilovolt (kV), 2.0 milliamp seconds (mAs)) with a Torrex 120 portable X-ray unit and a ScanX CR2500 imaging system. After imaging, cores were extruded and sliced at 2-cm intervals. Compaction from core transport and sampling (extrusion) was estimated by determining the difference between the measured core lengths before and after each procedure. Sedimentary characteristics (sediment texture, physical qualities, presence of roots/shells/burrow, and stratification type) were described in detail and hand-recorded on core description sheets during the sampling process. Surface Sediment Sample CollectionSurficial sediment samples (N=46) were collected from a network of permanent wetland monitoring sites within the Coastwide Reference Monitoring System (CRMS; Steyer, 2010). All sample sites were located in the Chenier Plain in southwest Louisiana and were sampled to include representative salinity regimes for the region. Samples were collected by pushing a 10-cm diameter PVC cylinder into the sediment and withdrawing the surface 2-cm by extrusion. This procedure was selected because it replicated the sampling intervals of the sediment cores. Samples were labeled using CRMS site identification numbers. All samples were stored in leak-proof containers, treated with isopropyl alcohol and immediately placed on ice to preserve the sample and reduce potential bacteria growth during transport. The samples remained refrigerated until processed. Laboratory AnalysesAll surface sediment samples were homogenized and processed at SPCMSC laboratory for bulk density, organic carbon (by loss-on-ignition), and grain size. A 30-milliliter (mL) sediment sample was weighed wet, dried in an oven at 60° Celsius (°C) until completely dry, and weighed again to calculate bulk density (dry mass divided by volume). Loss-on-ignition (LOI) was determined by grinding the dried sample to a fine powder and combusting a subsample at 650°C for four hours (Dean, 1974; Lewis and others, 2002; Moore and Reynolds, 1989). Approximately 50 percent of the samples were measured in triplicate to calculate sample error. Grain size was measured by laser diffraction using a CoulterLS 200particle-size analyzer after organic digestion. Digestion was accomplished by following the methods described in Soukup and others (2008). Approximately 5 grams (g) of sediment were placed in a 50-mL test tube, 15-mL of sodium hypochlorite was added, and the tube was placed in a warm water bath (80 °C) for 15 minutes. The sample was then centrifuged and supernatant was carefully removed with a pipette as to retain sediments. The sodium hypochlorite digestion was conducted at least three times to remove all organic matter. After digestion, 7 percent sodium hexametaphosphate solution was added to deflocculate clays. At a minimum, three aliquots of sediment were analyzed three times to generate a total of nine grain-size distributions for each sample. Percentage estimates for sand, silt, clay and mean phi were calculated from grain size distributions for each aliquot using GRADISTAT version 8 (Blott and Pye, 2001). The nine datasets were checked for unusual variations (for example, exceptionally high or low values which can be caused by partially undigested organics or debris) and data were removed if values deviated significantly (1 standard deviation from the mean) from the majority of aliquots. The remaining data were averaged to create a single estimate of grain size (percentage of sand, silt, and clay, and mean sediment size) for each sample. All sediment cores were extruded at 2-cm depth intervals, and each depth interval was analyzed for bulk density, organic carbon, and lead-dating. Bulk density and organic carbon were estimated with the same method used for surface sediment samples. Lead-210 was determined by measuring the activity of 210Po using alpha-spectrometry (Pheiffer Madsen and Sørensen, 1979). Polonium-210 is assumed to be in secular equilibrium with its parent 210Pb. The fired sample from LOI analysis was transferred to a glass beaker and 210Po was acid leached from the sediment. A known quantity of the tracer 209Po was added to the solution prior to auto-plating and counted on a low-level alpha spectrometer coupled to a pulse-height analyzer. Reported errors are the statistical counting errors at the 95 percent confidence interval. At least five samples per core were processed in duplicate to calculate relative standard deviation for an estimate of between-sample errors. Select core samples were identified for gamma-ray spectrometry (the presence of 137Cs) by examining 210Pb profile data, isolating the depth where excess 210Pb reaches zero (which provides a rough estimate downcore representing 100 years prior to the present), and estimating where 137Cs activity would likely be detected (1950 to 1984; Milan and others, 1995). Approximately 15 g of dried, ground sample was sealed in a plastic jar and stored for at least 3 weeks to allow radioisotope activity to reach equilibrium. A germanium detector was used for counting low-energy gamma rays in samples and a multi-channel analyzer was used for data collection. Samples outputs were measured for at least 24 hours or until counting errors were less than 5 percent. In addition, select core samples were processed for grain size by examining X-ray images and bulk density data to identify possible textural changes in sedimentary layers. Microfossil AnalysesAll surface sediment and select core sample intervals were analyzed for diatom microfossils. No attempt was made to separate autochthonous and allochthonous diatoms, and the assemblage from surface samples contained diatoms living at the time of sample collection. However, diatoms show a high degree of site fidelity and the consistent sampling method would provide a sufficient analogue to diatom assemblages found deeper within the sediment for paleo-reconstructions (Hassan and others, 2008). To extract diatoms, approximately 0.5 mL of sediment was digested in a 100-mL beaker using 30 percent hydrogen peroxide and potassium dichromate. Samples were rinsed twice with deionized (DI) water (the beaker was filled with DI water; sample was allowed to settle overnight, decanted to 500-mL mark, refilled, and repeat). Because samples contained a significant fraction of silt and clay, a 7 percent sodium hexametaphosphate solution was added to deflocculate the fine-grained sediments. Each sample was continually rinsed until decant was clear. A known volume (5 or 10 mL depending on the density of diatoms and sand grains) of diatom solution was added to settling trays containing four cover slips and allowed to dry (Battarbee, 1973). Cover slips were sealed to microscope slides using Zrax diatom mountant (refractive index ~ 1.7+). A minimum of 300 diatoms were identified to species and counted with a Nikon Optiphot light microscope at 1000x magnification (Plan 100x / 1.25 oil DIC objective). The identification of species and autecology, including general salinity preferences, were determined from taxonomic literature (Krammer and Lange-Bertalot, 1990-2009; Patrick and Reimer, 1966, 1975; Stidolph and others, 2012; Witkowski and others, 2000). |

![]() U.S. Department of the Interior |
U.S. Geological Survey
U.S. Department of the Interior |
U.S. Geological Survey
URL: http://pubsdata.usgs.gov/pubs/ds/0877/html/ds877_methods.html
Page Contact Information: GS Pubs Web Contact
Page Last Modified: Monday, 28-Nov-2016 20:31:33 EST