Data Series 988
The maps below show the division of the flight into areas and division of the flight path in each area into 5-minute (time) segments. Alternating purple and yellow lines represent each segment. Pages containing thumbnail images of the photographs, referred to as contact sheets, were created based on these segments. Click on each segment name to access the respective contact sheet. Refer to Table 1 for a list of images, latitude and longitude, and date and time, arranged by contact sheet.
Segment names are labeled with the following filename format: yyyy_mmdd_hhmmss, where yyyy denotes the year, mmdd denotes the month and day, and hhmmss denotes the start time of the 5-minute segment of time during which those photographs were taken. All times refer to Coordinated Universal Time (UTC). For example, segment 2012_0902_164000 was taken September 2, 2012, starting at 16:40:00 UTC. Best effort was made to set the camera's internal clock to within 1 second of UTC at the beginning of the flight.
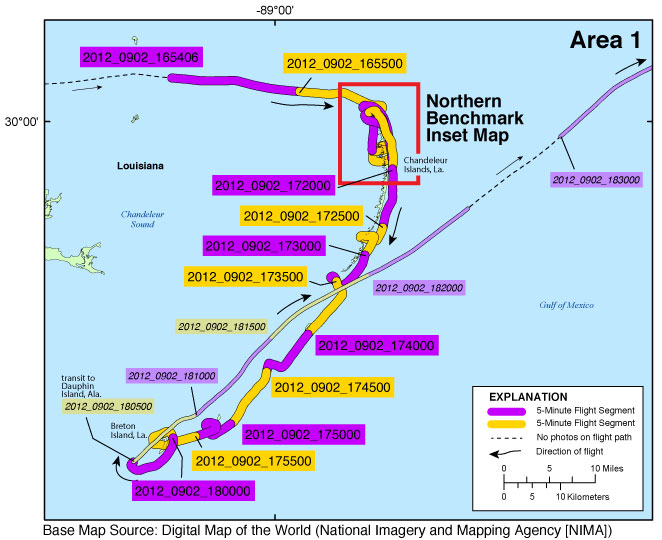
Figure 3A. Area 1 - Chandeleur Islands, Louisiana, through Breton Island, Louisiana. Map showing the post-Hurricane Isaac coastal oblique aerial survey flight path on September 2, 2012, divided into 5-minute (time) segments. The flight path is represented by the alternating purple and yellow lines. Pages containing thumbnail images of the photographs, referred to as contact sheets, were created based on these segments. Click on the 5-minute segment name to view each contact sheet. Click on the inset box to view a detailed map of the area. |
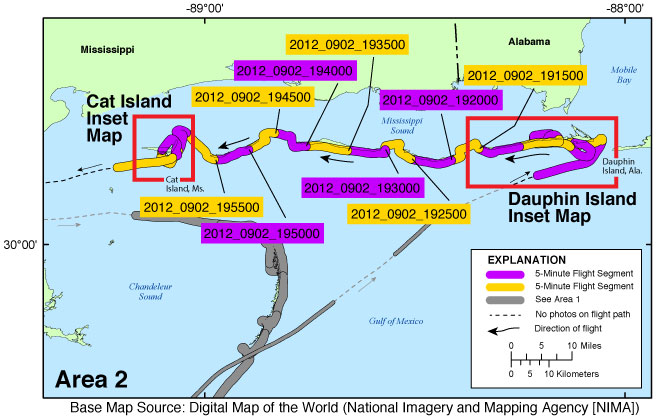
Figure 3B. Area 2 - Dauphin Island, Alabama, westward to Cat Island, Mississippi. Map showing the post-Hurricane Isaac coastal oblique aerial survey flight path on September 2, 2012, divided into 5-minute (time) segments. The flight path is represented by the alternating purple and yellow lines. Pages containing thumbnail images of the photographs, referred to as contact sheets, were created based on these segments. Click on the 5-minute segment name to view each contact sheet. Click on the inset box to view a detailed map of the area. |
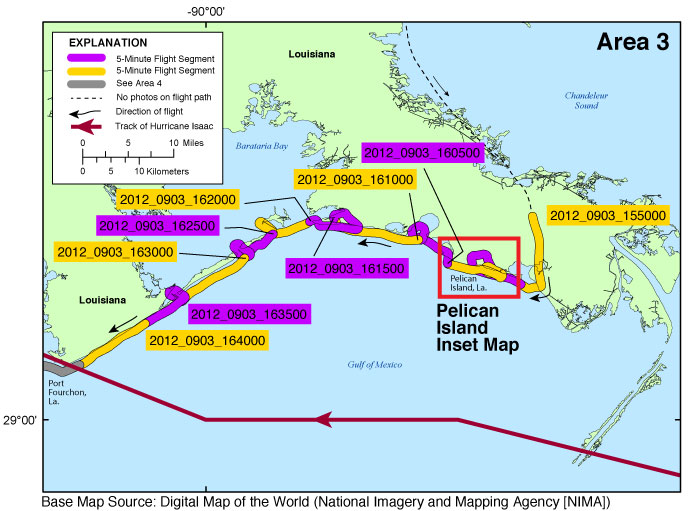
Figure 3C. Area 3 - Pelican Island, Louisiana, to Port Fourchon, Louisiana. Map showing the post-Hurricane Isaac coastal oblique aerial survey flight path on September 3, 2012, divided into 5-minute (time) segments. The flight path is represented by the alternating purple and yellow lines. Pages containing thumbnail images of the photographs, referred to as contact sheets, were created based on these segments. Click on the 5-minute segment name to view each contact sheet. Click on the inset box to view a detailed map of the area. |
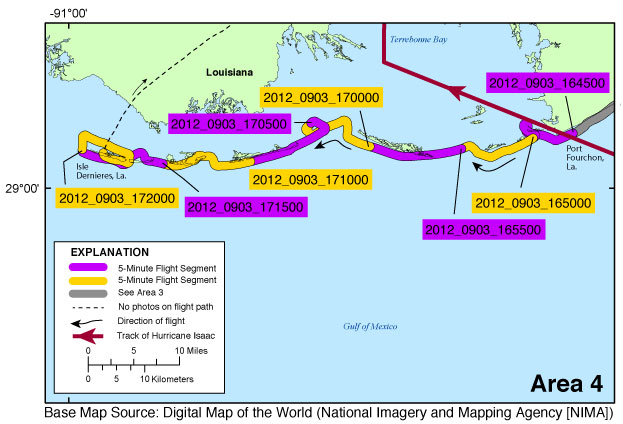
Figure 3D. Area 4 - Port Fourchon, Louisiana, to Isle Dernieres, Louisiana. Map showing the post-Hurricane Isaac coastal oblique aerial survey flight path on September 3, 2012, divided into 5-minute (time) segments. The flight path is represented by the alternating purple and yellow lines. Pages containing thumbnail images of the photographs, referred to as contact sheets, were created based on these segments. Click on the 5-minute segment name to view each contact sheet. |
Northern Benchmark Inset Map | Dauphin Island Inset Map | Cat Island Inset Map | Pelican Island Inset Map

![]() U.S. Department of the Interior |
U.S. Geological Survey
U.S. Department of the Interior |
U.S. Geological Survey
URL: http://pubsdata.usgs.gov/pubs/ds/0988/html/ds988_photos.html
Page Contact Information: GS Pubs Web Contact
Page Last Modified: Monday, 28-Nov-2016 20:45:50 EST
