Data Series 1047
| Data ProcessingRaw DataThe seismic data collected during each survey is currently located in the SPCMSC archives and arranged in cruise-specific storage boxes. The analog boomer data is in the form of 50-centimeter (cm)-wide paper rolls, paper fan-folds, and vellum rolls. The various rolls can be up to 20 m long and contain multiple seismic tracklines. The rolls contain the seismic profile image with pertinent collection characteristics annotated during acquisition, such as shot number and time (fig. 6) and may also include environmental conditions and equipment details. Horizontal lines across the profiles represent two-way travel time in milliseconds (ms), and vertical lines represent navigation fixes acquired and annotated as the survey was underway. The raw data was scanned on a Contex SD 3600 continuous-feed scanner. Using the NEXTimage 4 program (Contex), the scans were saved as 8-bit gray-scale TIFF files at 300 dots-per-inch (dpi) resolution. In order to minimize the final image file size for archiving, a batch conversion program was used to reduce the resolution to 210 dpi. The raw navigation data were imported into Esri ArcGIS version 10.3 as point data, converted to lines using the “make polylines from points” tool from the XTools Pro toolbar, and the attribute table was annotated with the cruise year. 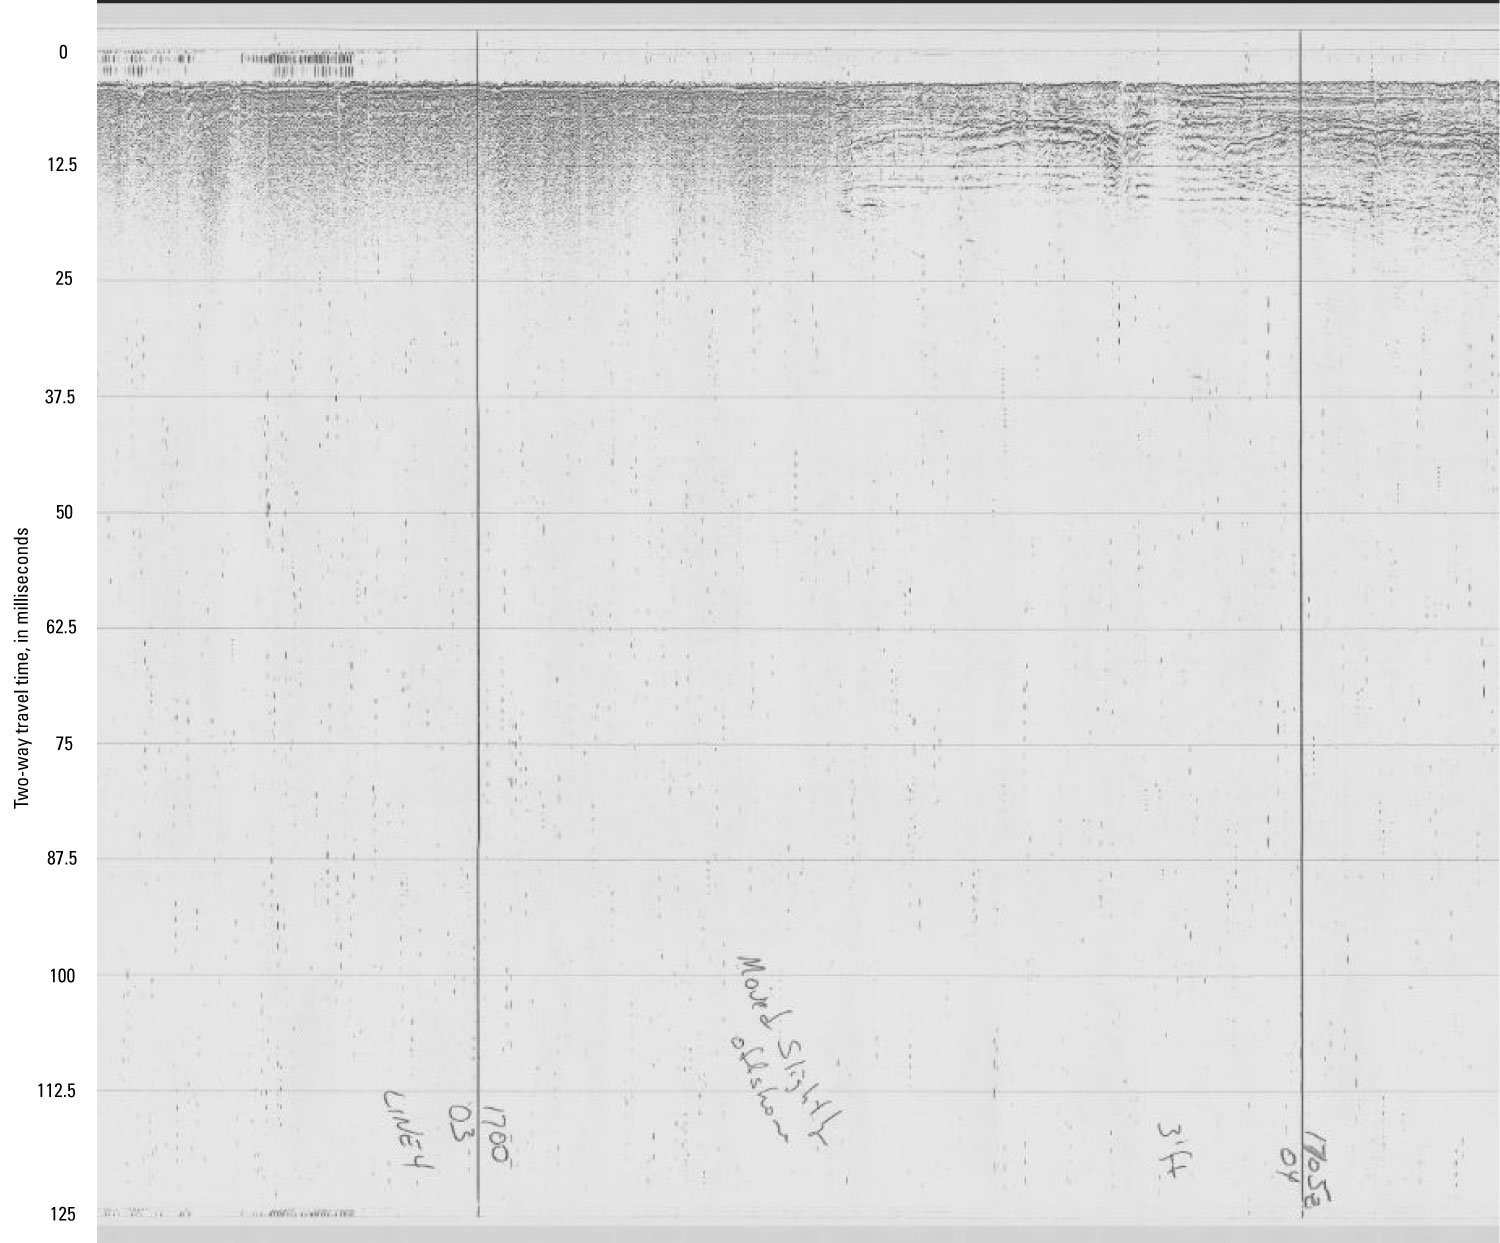 Figure 6. Screenshot showing an example of a seismic profile with annotations that include navigation fixes designated by the handwritten 2-digit shot number (03 and 04), the handwritten UTC time (1700 and 1705) of data collection (vertical lines), and depth below sea level in seismic two-way travel time (horizontal lines). In this particular figure, each horizontal line represents a seismic two-way time of 12.5 milliseconds (ms) below sea level. Sea level is equivalent to the 0 ms horizontal line. The labeled y-axis was added after the image was scanned to show the two-way time. [Click figure to enlarge] CroppingThe scanned images were imported into Adobe Photoshop (Ps) Creative Cloud 2015 and blank edge areas were cropped out to further reduce file size. For rolls that included more than one line of seismic data, the file was separated into individual lines. Separation was completed by cropping everything except for the line of interest (determined by the raw navigation information) from the original scan and saving it as a new file with its associated line name. The file naming convention is CruiseID-DataAssociation_trackline#.tif. It includes the cruise identification (for example, Erda91-3), the data association (for example, PWH [profiles with headers] or SEGY), and the trackline number (for example, 4); in full, the example is named as Erda91-3-SEGY_4.tif. Note that sometimes the trackline number also includes a subsection letter after the line number for tracklines split between multiple rolls. HeadersEach image of the scanned seismic profiles also includes a header with associated information including cruise- and line-specific information and processing details (fig. 7). The header files were created in Microsoft Word 2010, exported as PDF files, appended to the far left of the image frame in Adobe Ps, and then flattened onto the image to reduce file size. The final TIFF images with attached header files are available for download from Bosse and others (2017). 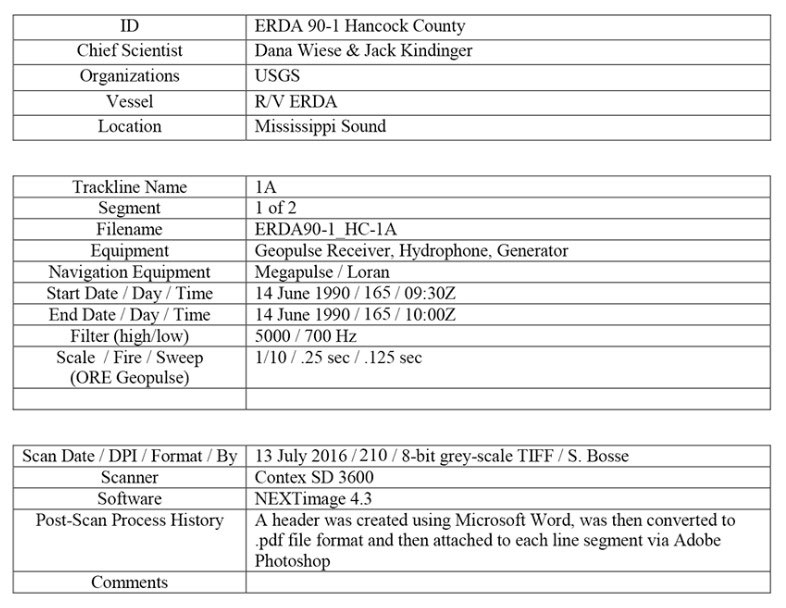 Figure 7. Screenshot showing an example of a header included for cruise-specific seismic profiles with various cruise information and processing details. The example shown here is from a line segment of the Erda 90-1_HC (ERDA 90-1 Hancock County) cruise in June of 1990. Abbreviations: Hz, hertz; ID, identification; ORE, Ocean Research Equipment; sec, seconds; Z, zero UTC time offset. Correcting Scan DistortionWhen scanning the vellum rolls, it was very difficult to ensure that the paper fed through the scanner perfectly straight. As a result, when the scanned file was brought into Adobe Ps, a straight reference was placed over the 0 ms line (water level) on the scan. It is important that horizontal lines are perpendicular to the vertical lines on the scans or the image to SEG-Y conversion will not be accurate. The distortion was corrected by using the Rectangular Marquee Tool in Adobe Ps to select the distorted area of the scan. A skewed transform was performed and the corrected images were saved into a new folder without layers (flattened) to reduce file size. Images to SEG-Y FormatThe scanned, distortion-corrected images were converted to digital SEG-Y (.seg) format (revision 0) (Barry and others, 1975) using the proprietary software ImageToSEGY 2.2 (Chesapeake Technology). The scanned images were opened in ImageToSEGY and the export area was defined by assigning values to the top, bottom, left, and right pixel locations (fig. 8) using the imaged water surface (0 ms), maximum two-way travel time (TWT; 112.5 ms) and raw navigation data for each line. Trace amplitudes in the scanned profiles are represented by pixels, so each pixel becomes a trace sample and the sample rate of the converted SEG-Y version is the record length divided by the number of vertical pixels in the profile. For example, if the profile is 4,435 pixels in the vertical and the two-way travel time is 112.5 ms, then the sample rate for the SEG-Y version is 0.025 ms. 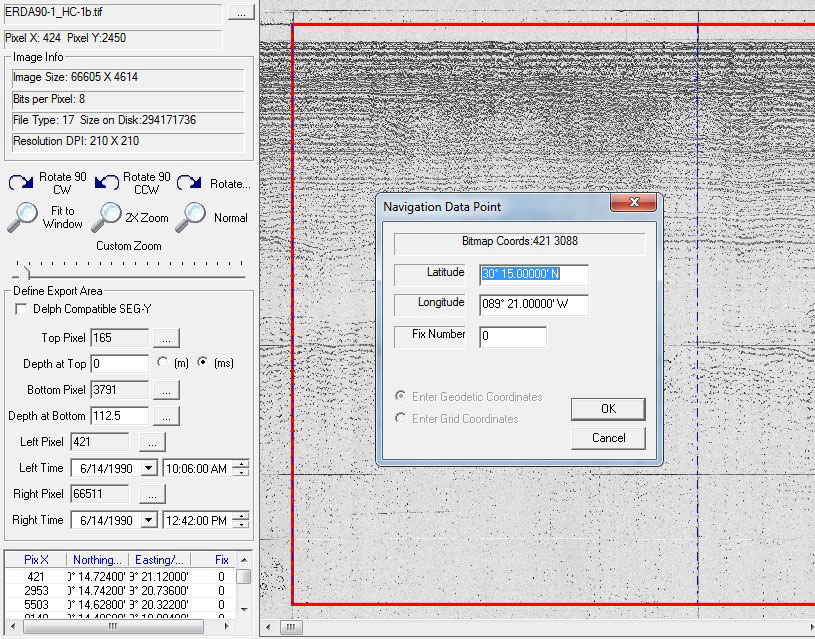 Figure 8. Screenshot showing an example of the ImagetoSEGY program displaying the scanned seismic profile, the file and image characteristics (upper left), the “Define Export Area” (middle left), the “Navigation Data Point” window (for navigational input), the navigation fixes (blue dashed lines), and the export area (red outline). |

![]() U.S. Department of the Interior |
U.S. Geological Survey
U.S. Department of the Interior |
U.S. Geological Survey
URL: http://pubsdata.usgs.gov/pubs/ds/1047/ds1047_data-processing.html
Page Contact Information: GS Pubs Web Contact
Page Last Modified: Wednesday, 19-Apr-2017 14:45:28 EDT
