 |
| Data Series 138: Nebraska, Kansas, and Oklahoma Complete-Bouguer Gravity Anomaly Map |
|
|
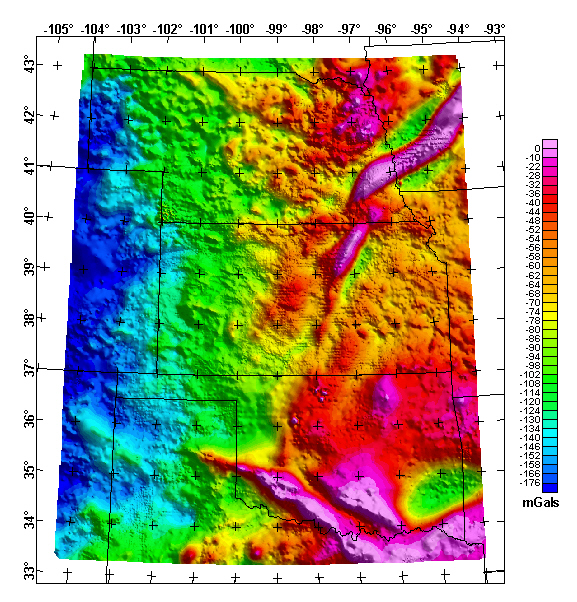
The colors on this Bouguer gravity anomaly map represent gravity variations resulting from lateral density variations in
the Earth. Positive anomalies (red colors) occur in areas with average density
greater than the Bouguer reduction density of 2.67 g/cc, whereas negative anomalies
(blue colors) occur in areas of lower density. The complete-Bouguer gravity
anomaly grid was compiled using data from 109,828 gravity stations (some of
them duplicate) in and adjacent to the States of Nebraska, Kansas, and Oklahoma.
These data were extracted from the gravity database maintained by the National
Geophysical Data Center (from Department of Defense unclassified data) (Hittleman and others, 1994). Observed gravity relative to the International Gravity Standardization Net
1971 (IGSN71) datum were reduced to the Bouguer anomaly using the 1967 gravity
formula (Cordell and others, 1982) and a reduction density of 2.67 g/cc. Terrain corrections were calculated radially
outward from each station to a distance of 167 km using a method developed
by Plouff (1977). The data were converted to a 1,000-m grid using minimum curvature techniques
and are displayed with an illumination from the northeast.
The grids for this map in two formats are available from the data directory as neksok_cba.***
Top || NE, KS, & OK Mag || References || Crustal Team

