4-6. Magnetic susceptibility measurements
[M. Coombs]
Methods
Onboard magnetic susceptibility (MS) measurements
were made on all piston core samples using
a Bartington Instruments MS2C susceptibility
bridge connected to a laptop PC. After the
cores were cut into 1 m sections and split,
the archive half of each section was passed
through the MS bridge in 2 cm intervals.
The volume of each measurement was assumed
to be a semi-sphere with a diameter of 8
cm (the diameter of the core). Volume deficiencies
that resulted from physical gaps in the core,
as well as measurements made near the ends
of core sections, resulted in low MS values,
which were deleted from the datasets. As
data were obtained section by section, section
data were later compiled and plotted for
each piston core, as shown in the appendix.
MS values are given in SI units.
Observations
The onboard susceptibility measurements,
while not as precise as discrete measurements,
provided immediate useful information to
shipboard scientists. In most cases, high
MS values correspond very well to the presence
of visible black, volcanic sand in the piston
cores. Presumably this is due to the presence
of magnetite in the sands, which are interpreted
to be turbidite deposits from landslide events
off the Hawaiian islands. Because of the
correlation with turbidites, MS profiles
from geographically neighboring piston cores
correlate very well with one another.
Visually identified volcanic sand units have
MS values ranging from 220 to 400. Pelagic
sediment, the dominant lithology of the cores,
typicall y ranges from 40-100. In two cores,
PC10 and PC-11, fossiliferous ooze was identified.
This wholly biogenic material has very low
MS, with values of 2-8.
The following list outlines some of the most
useful and interesting aspects of the onboard
MS measurements:Identification of coring inflow. Portions
of several cores, especially at the bases,
were observed to have structures indicative
of inflow during the coring process. For
these portions of the cores, the MS values
were abnormally constant, suggesting that
efficient mixing of sedimentary layers occurred
during inflow, and providing a confirmation
of visual observations.
Identification of volcanogenic material.
A comparison of visual observations and MS
measurements for a given piston core reveals
a strong correlation between black sand layers
and high MS, as would be expected. However,
several cores show intervals of high MS that
do not correlate with visible black sand
layers. These horizons may contain volcanic
material, but not in high enough abundance
to be visible. We will be able to confirm
this by closer examination of the horizons
at a later time.
As recognized by Naka et al. (2001) pelagic
sediment between sand layers can contain
volcanic glass fragments. The range of MS
for the sediments between sand layers likely
reflects this. Some of the high MS horizons
in the cores have a peak at the base and
gradual decrease in MS up section. This may
reflect initial pulses of volcanic sand followed
by reworking and mixing with pelagic sediments,
and thus could provide information on turbidite
emplacement processes.
Determination of glass versus lithic content
of black sand layers. Visible black sand
layers have MS values typically between 230
and 400, with one layer having MS of 552
(PC-13, 130 cm bsf).Likely this wide array
of MS values reflects varying proportions
of glass versus lithic contents in the sands.
This seems to be corroborated by preliminary
observations of smear slides, but more detailed
work is needed to quantify the relationship
between MS and lithic/glass ratios.
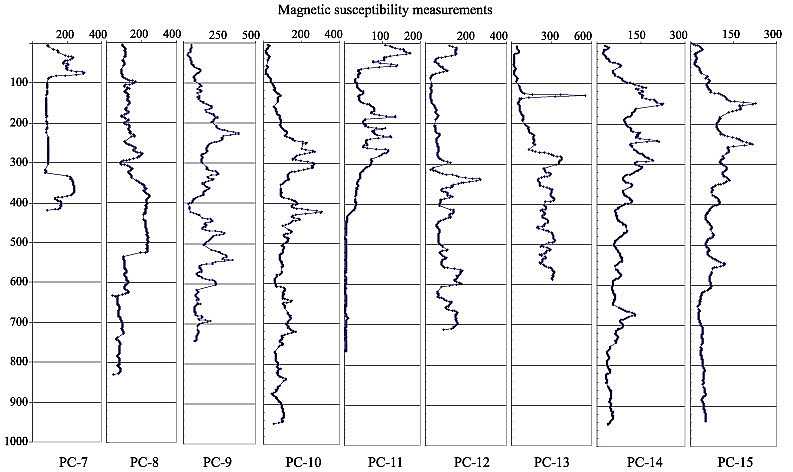
Figure pc3. Magnetic susceptibility profile
of core PC7 through 15

 home
home 