
Home | Contents | Site Map | Introduction | usSEABED | dbSEABED | Data Catalog | References | Contacts | Acknowledgments | Frequently Asked Questions | Disclaimer | Accessibility
 |
 |
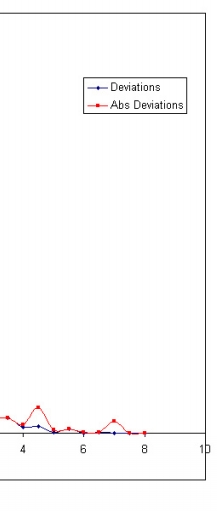 |
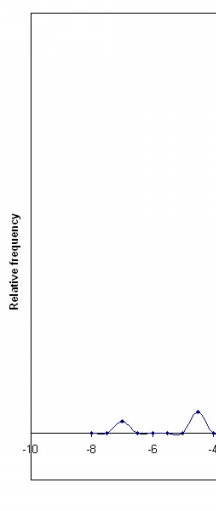
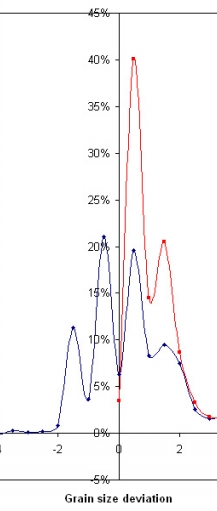
Figure 3. Statistical calibration of outputs for grain sizes, shown using a frequency plot of the deviations between PRS and EXT data, using an improving Atlantic Coast dataset. Deviations are the result of inaccuracies in EXT and PRS input data, as well as to identifiable issues in the data as highlighted below in fig. 4. The 50, 68, and 95 percent confidences are 0.8, 1.3, 4.3 phi, respectively. |
||
Home | Contents | Site Map | Introduction | usSEABED | dbSEABED | Data Catalog | References | Contacts | Acknowledgments | Frequently Asked Questions | Disclaimer | Accessibility
Accessibility | FOIA | Privacy | Policies and Notices
U.S. Department of the Interior U.S. Geological Survey
URL: https://pubs.usgs.gov/ds/2006/182/calib_fig3.html
maintained by Mike Diggles
last modified 25 May 2006 (jar)