Skip header
 Identifier symbol and link to USGS Home page

U.S. Geological Survey Data Series 182, usSEABED: Pacific Coast Offshore Surficial-Sediment Data Release, version 1.0 Skip navigational side bar

Home | Contents | Site Map | Introduction | usSEABED | dbSEABED | Data Catalog | References | Contacts | Acknowledgments | Frequently Asked Questions | Disclaimer | Accessibility


Examples of usSEABED data usage

The following three images show just a few ways in which the data can be displayed within a GIS:

Click on each for a larger image.

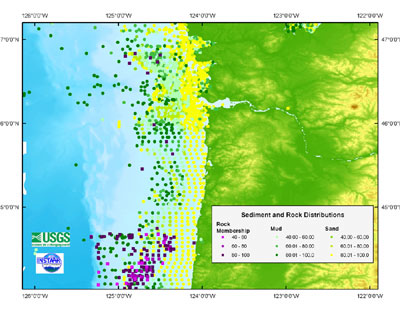
Figure 5. Image of grain-size distributions (gravels, sands, and muds) and hard bottom on the continental shelf near the mouth of the Columbia River from usSEABED as an example of extracted, parsed, and calculated data.
Figure 5. Grain-size distributions of sand (yellows) and mud (greens) with areas of hard-bottom (purples) off Oregon, using extracted (EXT) and parsed data (PRS).

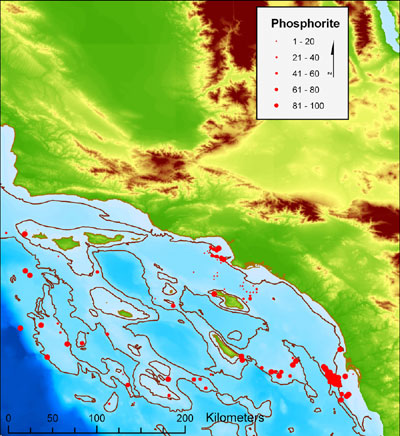
Figure 6. Image of the relative presence of phosphorite (in relative sizes of circles) in Southern California from usSEABED as an example of component data.
Figure 6. Relative presence of phosphorite in southern California using the component (CMP) data.

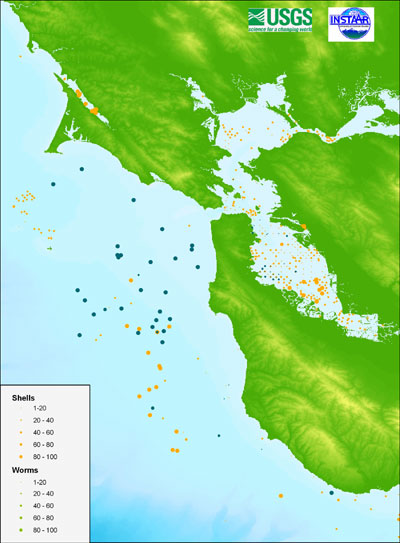
Figure 7. Image of the distribution of shells and worms, along the Central California continental shelf and San Francisco Bay, as an example of facies data from usSEABED.
Figure 7. Presence of shells (orange) and worms (blues) in central California using the facies (FAC) file.


Home | Contents | Site Map | Introduction | usSEABED | dbSEABED | Data Catalog | References | Contacts | Acknowledgments | Frequently Asked Questions | Disclaimer | Accessibility


Accessibility  |  FOIA  |  Privacy  |  Policies and Notices
U.S. Department of the Interior    U.S. Geological Survey

URL: https://pubs.usgs.gov/ds/2006/182/examples.html
maintained by Mike Diggles
last modified 25 May 2006 (jar)