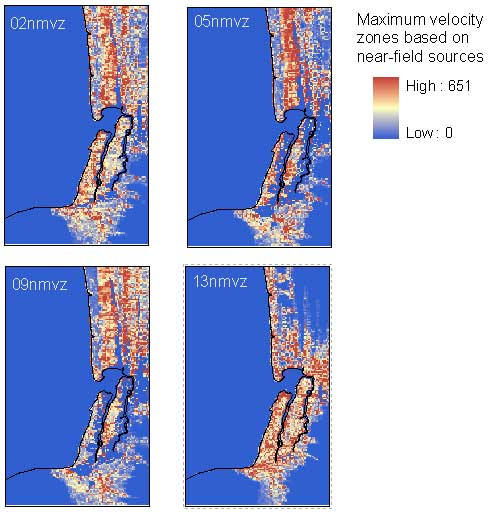
NOAA Center for Tsunami Research, 2006, Maximum Velocity Zones at Seaside, Oregon based on Near-field Sources: U.S. Geological Survey, Menlo Park, California.This is part of the following larger work.Online Links:
Wong, Florence L. , Venturato, Angie J. , and Geist, Eric L. , 2006, Seaside, Oregon Tsunami Pilot Study -- Modernization of FEMA Flood Hazard Maps: GIS Data: U.S. Geological Survey Data Series 236, U.S. Geological Survey, Menlo Park, California.Online Links:
This is a Raster data set. It contains the following raster data types:
Horizontal positions are specified in geographic coordinates, that is, latitude and longitude. Latitudes are given to the nearest 0.000556. Longitudes are given to the nearest 0.000556. Latitude and longitude values are specified in Decimal degrees.
The horizontal datum used is North American Datum of 1983.
The ellipsoid used is Geodetic Reference System 80.
The semi-major axis of the ellipsoid used is 6378137.000000.
The flattening of the ellipsoid used is 1/298.257222.
Titov et al. (1999 and 2005)
206-526-6556 (voice)
Angie.J.Venturato@noaa.gov
This data set is one of a collection of spatially referenced digital files in a geographic information system related to the Seaside, Oregon, Tsunami Pilot Study.Federal Emergency Management Agency (FEMA) Federal Insurance Rate Map (FIRM) guidelines do not currently exist for conducting and incorporating tsunami hazard assessments that reflect the substantial advances in tsunami research achieved in the last two decades (Tsunami Pilot Study Working Group, 2006). Therefore, as part of the FEMA Modernization Program, a Tsunami Pilot Study was carried out in the Seaside/Gearhart, Oregon, area to provide information from which tsunami mapping guidelines could be developed. This area was chosen because it is typical of coastal communities in the section of the Pacific Coast from Cape Mendocino to the Strait of Juan de Fuca. There was also considerable interest shown by state agencies and local stakeholders in mapping the tsunami threat to this region. The study was an interagency effort by scientists from the U.S. Geological Survey, the National Oceanic and Atmospheric Administration, the University of Southern California, and the Middle East Technical University. We present the GIS data from that report in this publication.
These data are intended for science researchers, students, policy makers, and the general public. The data can be used with geographic information systems (GIS) software to display geologic and oceanographic information.
Titov, V.V., F.I. Gonzalez, E.N. Bernard, M., 2005, Real-time tsunami forecasting: Challenges and solutions.Online Links:
Data sources used in this process:
Data sources produced in this process:
Tsunami Pilot Study Working Group, 2006, Seaside, Oregon Tsunami Pilot Study -- Modernization of FEMA Flood Hazard Maps: U.S. Geological Survey Open-File Report 2006-1234, U.S. Geological Survey, Menlo Park, California.Online Links:
NOAA Center for Tsunami Research, 2006, Near-field Sources for the Seaside, Oregon Tsunami Pilot Study: U.S. Geological Survey, Seattle, Washington.
Complete.
The data set was converted from a netCDF files and checked for logical consistency.
Are there legal restrictions on access or use of the data?
- Access_Constraints: None.
- Use_Constraints:
- These data were created for the sole purpose of the Seaside, Oregon, Tsunami Pilot Study. It is not meant for navigational means. The National Oceanic and Atmospheric Administration makes no expressed or implied warranty regarding the accuracy of these data.
The act of distribution shall not constitute any such warranty, and no responsibility is assumed by the U.S. Geological Survey in the use of these data on any other system.
Any use of trade, firm, or product names is for descriptive purposes only and does not imply endorsement by the U.S. Government.
1-888-275-8747 (voice)
infoservices@usgs.gov
U.S. Geological Survey Data Series 236
The act of distribution shall not constitute any warranty expressed or implied by the U.S. Geological Survey as to the accuracy of these data, and no responsibility is assumed by the U.S. Geological Survey in the use of these data on any other system.
| Data format: | ARCE (version 9.1) ArcGIS shapefile Size: 0.355 |
|---|---|
| Network links: |
<https://pubs.usgs.gov/ds/2006/236/> |
206-526-6556 (voice)
Angie.J.Venturato@noaa.gov