Wong, Florence L. , and Geist, Eric L. , 2006, Generalized 100- and 500-year flood zones for Seaside, Oregon, determined by probabilistic tsunami hazard analysis (probzones.shp):.This is part of the following larger work.Online Links:
Wong, Florence L. , Venturato, Angie J. , and Geist, Eric L. , 2006, Seaside, Oregon Tsunami Pilot Study - Modernization of FEMA Flood Hazard Maps: GIS Data: U.S. Geological Survey Data Series 236, U.S. Geological Survey, Menlo Park, California.Online Links:
This is a Vector data set. It contains the following vector data types (SDTS terminology):
Horizontal positions are specified in geographic coordinates, that is, latitude and longitude. Latitudes are given to the nearest 0.0006. Longitudes are given to the nearest 0.0006. Latitude and longitude values are specified in Decimal degrees.
The horizontal datum used is North American Datum of 1983.
The ellipsoid used is Geodetic Reference System 80.
The semi-major axis of the ellipsoid used is 6378137.000000.
The flattening of the ellipsoid used is 1/298.257222.
Sequential unique whole numbers that are automatically generated.
Coordinates defining the features.
Feature area
Feature perimeter
ESRI internal number
user-assigned feature number
| Value | Definition |
|---|---|
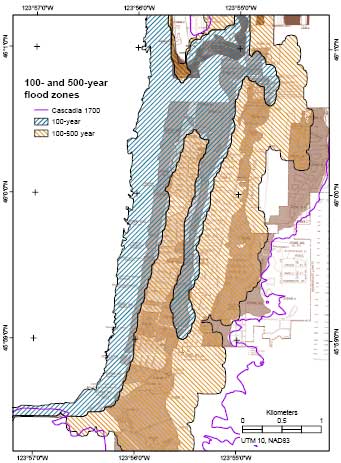
| A | 100-year flood polygon |
| B | 500-year flood polygon |
650-329-5327 (voice)
650-329-5190 (FAX)
fwong@usgs.gov
This data set is one of a collection of digital files of a geographic information system of spatially referenced data related to the Seaside, Oregon, Tsunami Pilot Study.Federal Emergency Management Agency (FEMA) Federal Insurance Rate Map (FIRM) guidelines do not currently exist for conducting and incorporating tsunami hazard assessments that reflect the substantial advances in tsunami research achieved in the last two decades (Tsunami Pilot Study Working Group, 2006). Therefore, as part of FEMAs Modernization Program, a Tsunami Pilot Study was carried out in the Seaside/Gearhart, Oregon, area to provide information from which tsunami mapping guidelines could be developed. This area was chosen because it is typical of coastal communities in the section of the Pacific Coast from Cape Mendocino to the Strait of Juan de Fuca. There was also considerable interest shown by state agencies and local stakeholders in mapping the tsunami threat to this area. The study was an interagency effort by scientists from the U.S. Geological Survey, the National Oceanic and Atmospheric Administration, the University of Southern California, and the Middle East Technical University. We present the GIS data from that report in this publication.
These data are intended for science researchers, students, policy makers, and the general public. The data can be used with geographic information systems (GIS) software to display geologic and oceanographic information.
Venturato, Angie J. , 2005, A digital elevation model for Seaside, Oregon: Procedures, data sources, and analyses: NOAA, Technical Memorandum OAR PMEL-129.Online Links:
Tsunami Pilot Study Working Group, 2006, Seaside, Oregon Tsunami Pilot Study - Modernization of FEMA Flood Hazard Maps: U.S. Geological Survey Open-File Report 2006-1234, U.S. Geological Survey, Menlo Park, California.Online Links:
Mofjeld, H.O., Venturato, A.J., Gonz\341lez, F, 2004, Background tides and sea level variations at Seaside, Oregon: NOAA, Technical Memorandum OAR PMEL-126.Online Links:
Geist, Eric L. , 2005, Local Tsunami Hazards in the Pacific Northwest from Cascadia Subduction Zone Earthquakes: U.S. Geological Survey Professional Paper 1661-B.Online Links:
The polygon attribute for this data set is either the 100- or 500-year flood area as determined by the probabilistic tsunami hazard analysis. The accuracy of one or the other value assignment is tied to the model accuracy, the discussion of which is copied here.
The maximum wave heights presented here were modeled by probabilistic tsunami hazard analysis techniques and approximate the magnitudes of a 1% annual probability flood. Accuracy with these estimates can be associated with uncertainty in the model results. Sources of aleatory uncertainty from fault rupture complexity and tidal stage at tsunami arrival time. For the former, the coefficient of variation is typically 20% (Geist, 2005). For the latter, the coefficient of variation is typically 7% (Mofjeld and others, 2004). A comprehensive analysis for other sources of aleatory and epistemic uncertainty has not been conducted for this pilot study.
The model raster from which this data set was derived was defined on a 2-second grid spacing (approximately 60 meters north-south) which was maintained through all calculations.
Complete.
Polygon topology is intact.
Are there legal restrictions on access or use of the data?
- Access_Constraints: None.
- Use_Constraints:
- The data, digital results, GIS layers, and map products in this database have been created specifically as part of a pilot study for FEMA's modernization of Flood Insurance Rate Maps (FIRMs) project. The results of the pilot study are intended to help FEMA draft new guidelines related to tsunami flooding for Coastal Flood Hazard Analysis and Mapping for the Pacific Coast of the United States. The results are intrinsically probabilistic and designed according to FEMA flood zone specifications: annual probabilities of exceedance of 1% and 0.2%. The data, digital results, GIS layers, and map products are not intended for other uses. In particular, the 1% and 0.2% annual exceedance probability tsunami flood maps are not to be used for emergency planning, evacuation, or other insurance purposes. Please refer to the National Tsunami Hazard Mitigation Program tsunami inundation maps for use in emergency planning.
Please recognize the U.S. Geological Survey (USGS) as the source of this information.
Although these data have been used by the U.S. Geological Survey, U.S. Department of the Interior, no warranty expressed or implied is made by the U.S. Geological Survey as to the accuracy of the data.
The act of distribution shall not constitute any such warranty, and no responsibility is assumed by the U.S. Geological Survey in the use of this data, software, or related materials.
This information is not intended for navigational purposes.
Any use of trade, firm, or product names is for descriptive purposes only and does not imply endorsement by the U.S. Government.
1-888-275-8747 (voice)
infoservices@usgs.gov
U.S. Geological Survey Data Series 236
This information is not intended for navigational purposes. Any use of trade, firm, or product names is for descriptive purposes only and does not imply endorsement by the U.S. Government.
| Data format: | ARCE (version 9.1) shapefile Size: 0.093 |
|---|---|
| Network links: |
<https://pubs.usgs.gov/ds/2006/236/> |
650-329-5327 (voice)
650-329-5190 (FAX)
fwong@usgs.gov