Data Series 278, v. 4.0
1 U.S. Geological Survey, Menlo Park, Calif.
2 National Park Service, Yellowstone National Park, Mammoth, Wyo.
The Yellowstone Volcano Observatory (YVO) was established to "To strengthen the long-term monitoring of volcanic and earthquake unrest in the Yellowstone National Park region". Yellowstone National Park is underlain by a voluminous magmatic system overlain by the most active hydrothermal system on Earth. Tracking changes in water and gas chemistry is of great importance because anomalous fluxes might signal one of the earliest warnings of volcanic unrest.
Because of the tremendous number, chemical diversity, and large aerial coverage of Yellowstone's thermal features, it remains daunting to monitor individual features that might serve as proxies for anomalous activity in the hydrothermal system. Sampling rivers provides some advantages, because they integrate chemical fluxes over a very large area and therefore, river fluxes may reveal large-scale spatial patterns (Hurwitz et al., 2007). In addition, based on the application of the chloride-enthalpy method (Fournier, 1979), quantifying chloride flux in rivers provides an estimate of the total heat discharge from the Yellowstone volcanic system (Norton and Friedman 1985; Fournier, 1989; Friedman and Norton, 2007).
Intermittent sampling of the large rivers draining Yellowstone National Park began in the 1960’s (Fournier et al., 1976) and continuous sampling has been carried out since water year (1 October - 30 September) 1983 excluding water years 1995 and 1996 (Norton and Friedman, 1985, 1991; Friedman and Norton, 1990, 2000, 2007). Between 1983 and 2001 only Cl concentrations and fluxes were determined. Starting in water year 2002, the concentrations and fluxes of other anions of possible magmatic origin (F-, Br-, HCO3- , and SO42-) were also determined, and several new sampling sites were established (Hurwitz et al., 2007). The ongoing sampling and analysis of river solute flux is a key component in the current monitoring program of YVO, and it is a collaboration between the U.S. Geological Survey and Yellowstone National Park.
Following the protocols of Friedman and Norton (in press), water samples are collected from the major rivers once per month between November and February, every two weeks in March, April, August, September and October, and once a week between May and July, for a total of 28 samples per year for each river. However, the actual number of collected samples is less in many cases. Samples are collected at, or close to, a USGS stream gage site.
Concentrations of Cl-, F-, Br-, and SO42- are determined with a Dionex ion chromatograph ICS-2000 at the U.S. Geological Survey in Menlo Park, California. Analytical errors for these constituents are typically <2 %. Total alkalinity as HCO3- is determined on stored samples, usually several months after collection. Ten milliliters of sample are titrated with 0.05 N H2SO4 to the bicarbonate end-point. The analytical error in alkalinity concentrations is roughly ±5%.
River discharge at the time of sampling was obtained from the U.S. Geological Survey’s National Water Information System for the rivers sampled. The automated stream discharge measurements are made every 15 minutes, and the discharge at each of the rivers is measured manually several times each year to establish rating curves. At low discharges, differences between the manual and automatic measurements are typically less than 5%. At high flow rates, errors can be higher.
The database (Version 4.0) is a MS-Excel file that contains the concentrations of Cl-, F-, Br-, SO42-, and HCO3- and the water discharge at the time of sampling for each of the rivers studied. The database will be updated periodically as new data is gathered. The reported discharge values are preliminary until final approval by the U.S. Geologic Survey, typically several months after the end of the water year. Preliminary discharge data is written in blue.
|
The Following rivers are being sampled |
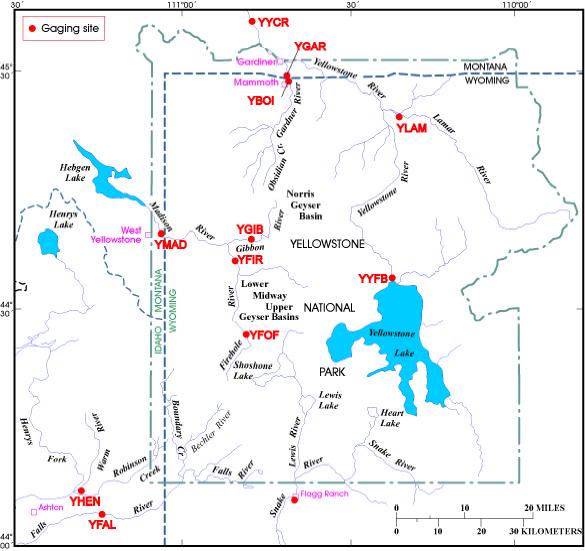
Map of the Yellowstone National Park region showing the major rivers and the gaging and sampling sites mentioned in this database. The Yellowstone National Park boundary is shown in dash-dot lines, and state borders are shown in dashed lines. |
The entries in the spreadsheet appear in the following columns:
* Originally, the sample ID consisted of three letters and six numeric characters: Y for Yellowstone Park; one letter for the river name; an R for river; followed by a six digit date code (MMDDYY). Starting in 2006, we use a 10 digit alpha-numeric code: Y for Yellowstone normally followed by the first three letters of the river's name i.e. YGAR - Gardner River in Yellowstone. For rivers which we sample in multiple locations the 4 letter code is as follows: Y - Yellowstone: one letter for the river name; two letters to indicate the site location i.e. YYCO - Yellowstone River at Corwin Springs. The final 6 digits still represent a date (MMDDYY).
We thank Jeff Arnold, Kitty Eneboe, Christine Greve, Paul Miller, Kathleen O’Leary Dave Phillips, John McEvoy, Jeremy Erickson, Hillary Billman, Nicole Legere and Tara Ross (all from Yellowstone NP) for sampling, and Atosa Abedini (USGS) for chemical analysis.
For information, contact: Shaul Hurwitz

![]() U.S. Department of the Interior |
U.S. Geological Survey
U.S. Department of the Interior |
U.S. Geological Survey
URL: http://pubsdata.usgs.gov/pubs/ds/2007/278/index.html
Page Contact Information: GS Pubs Web Contact
Page Last Modified: Monday, 28-Nov-2016 12:28:50 EST
