Data Series 282
U.S. GEOLOGICAL SURVEY
Data Series 282
The output from each of the three types of sensors used for this study is proportional to the SSC in the water column at the depth of the sensor. SSC calculated from the output of side-by-side sensors with different instrument designs were virtually identical (Buchanan and Schoellhamer, 1998). Calibration of the sensor output to SSC will vary according to the size and optical properties of the suspended sediment; therefore, the sensors must be calibrated by using suspended material from the field (Levesque and Schoellhamer, 1995).
The output from the optical sensors was used to calculate SSC by linear regression using the robust, nonparametric, repeated median method (Siegel, 1982) rather than ordinary least squares (OLS) regression. Constant variance of residuals is a necessary condition for use of OLS regression to obtain the best linear unbiased estimator of a variable (Helsel and Hirsch, 1992, p.225). The variance of the residuals for some datasets in this study increased with voltage and was not constant; therefore, robust regression was considered to be more appropriate than OLS regression for the development of calibration curves in most cases.
The prediction interval and the 95-percent confidence interval were calculated and presented for each calibration equation. Whenever possible, water-sample data collected in previous water years were included in the calibrations to incorporate the largest range of observed concentrations. Previously collected water-sample data were disgarded if a sensor’s calibration had drifted.
The repeated-median method calculates the calibration slope in a two-part process. First, for each point (X,Y) in a set of n data points, the median of all possible “point i” to “point j” slopes was calculated
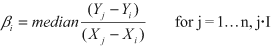 (1)
(1)
The calibration slope was calculated as the median of βi
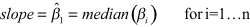 (2)
(2)
Finally, the calibration intercept was calculated as the median of all possible intercepts by using the slope calculated above
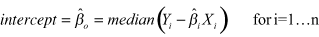 (3)
(3)
The final linear calibration equation is
 (4)
(4)
The nonparametric prediction interval (PInp) (Helsel and Hirsch, 1992, p. 76) is a constant-width error band that contains about 68-percent, or one standard deviation, of the calibration data set. The 68-percent value was selected because essentially it has the same error prediction limits as the root-mean-squared (RMS) error of prediction that was used to describe the error associated with parametric OLS regression methods in previous data reports (Buchanan and Schoellhamer, 1995, 1996, 1998, 1999; Buchanan and others, 1996) to analyze random sets of normally distributed data. The prediction interval describes the likelihood that a new observation comes from the same distribution as the previously collected data set.
The PInp, unlike the RMS error of prediction, frequently is not symmetrical about the regression line. For example, the PInp may be reported as +10 and -7 mg/L. This asymmetry about the regression line is a result of the distribution of the data set. The PInp is calculated by computing and sorting, from least to greatest, the residuals for each point. Then, based on the sorted list of residuals
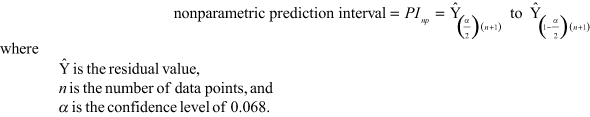 (5)
(5)
To calculate the confidence interval for the regression line slope, all possible point-to-point slopes must be sorted in ascending order. On the basis of the confidence interval desired, 95-percent for the purposes of this report, the ranks of the upper and lower INTERVALs are calculated as follows:
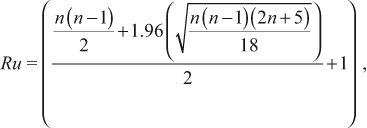 (6)
(6)
and
 (7)
(7)
To establish the 95-percent confidence interval, the ranks calculated above are rounded to the nearest integer and the slope associated with each rank in the sorted list is identified. Equations (6) and (7), which represent large-sample approximations for the ranks, were used for each of the confidence intervals presented in this report. However, for those sites that had fewer than 10 samples, an alternative and presumably slightly more accurate method described by Helsel and Hirsch (1992, p. 273-274) could have been used to calculate upper and lower bound ranks.
A statistical summary of the SSC calculated from optical sensor data is presented in table 2. The usable percentage of a complete year of valid data (96 data points per day × 365 days) for each site also is presented in table 2.
This section of the report also includes figures showing graphical results of the regression analysis (calibration) relating SSC (in mg/L) to optical sensor output. The calibration figures (for example, fig. 4) include the number of water samples (data points) (all water samples used to develop calibration, including those from previous water years), the linear regression equation, the nonparametric prediction interval (shown on the calibration figures as a grey band), and the 95-percent confidence interval for the regression-line slope. In addition, the time-series plots of calculated SSC data are shown for each site.
PERIOD OF CALIBRATION.—
NEAR-SURFACE SENSOR: WY 2005 (fig. 4A).
NEAR-BOTTOM SENSOR: WY 2005 (fig. 4B).
NUMBER OF DATA POINTS (WATER SAMPLES) USED FOR CALIBRATION.—
NEAR-SURFACE SENSOR: 36 (15 from WY 2005).
NEAR-BOTTOM SENSOR: 37 (16 from WY 2005).
LINEAR REGRESSION EQUATION.—
NEAR-SURFACE SENSOR: SSC = 0.723 × millivolt (mV) + 7.6.
NEAR-BOTTOM SENSOR: SSC = 0.735 × mV + 5.3.
NONPARAMETRIC PREDICTION INTERVAL.—
NEAR-SURFACE SENSOR: +6 to -3 mg/L.
NEAR-BOTTOM SENSOR: +11 to -3 mg/L.
95-PERCENT CONFIDENCE INTERVAL ON SLOPE CALCULATION.—
NEAR-SURFACE SENSOR: 0.636 to 0.875.
NEAR-BOTTOM SENSOR: 0.641 to 1.001.
REMARKS.—There were no interruptions in the record. Sensors were positioned at near-surface (attached to float assembly) and near-bottom depths to coincide with DWR near-surface pump intake and the near-bottom electrical conductance and temperature sensors. The calculated SSC time-series data collected for WY 2005 are presented in figure 5.
PERIOD OF CALIBRATION.—
NEAR-SURFACE SENSOR: WY 2005 (fig. 6).
NEAR-BOTTOM SENSOR (A): October 1, 2004, to November 23, 2004 (fig. 7A).
NEAR-BOTTOM SENSOR (B): November 23, 2004, through September 30, 2005 (fig. 7B).
NUMBER OF DATA POINTS (WATER SAMPLES) USED FOR CALIBRATION.—
NEAR-SURFACE SENSOR: 33 (15 from WY 2005, 1 from WY 2006).
NEAR-BOTTOM SENSOR (A): 33 (2 from WY 2005).
NEAR-BOTTOM SENSOR (B): 25 (13 from WY 2005).
LINEAR REGRESSION EQUATION.—
NEAR-SURFACE SENSOR: SSC = 0.916 × NTU + 6.5.
NEAR-BOTTOM SENSOR (A): SSC = 1.138 × NTU + 10.1.
NEAR-BOTTOM SENSOR (B): SSC = 1.125 × NTU + 21.3.
NONPARAMETRIC PREDICTION INTERVAL.—
NEAR-SURFACE SENSOR: +8 to -6 mg/L.
NEAR-BOTTOM SENSOR (A): +22 to -9 mg/L.
NEAR-BOTTOM SENSOR (B): +11 to -18 mg/L.
95-PERCENT CONFIDENCE INTERVAL ON SLOPE CALCULATION.—
NEAR-SURFACE SENSOR: 0.824 to 1.100.
NEAR-BOTTOM SENSOR (A): 1.044 to 1.352.
NEAR-BOTTOM SENSOR (B): 0.909 to 1.259.
REMARKS.—Interruptions in record were caused by fouling or malfunction of the sensing and(or) recording instruments. MLLW was approximately 80 ft at the site but approximately 60 ft immediately adjacent. Therefore, the near-bottom sonde was set approximately 25 ft above the bottom so that the data are representative of the surrounding area. The near-surface sonde malfunctioned and was replaced on July 29, 2005. Because the two near-surface optical sensors responded similarly to the uniform sediment characteristics of San Francisco Bay (Schoellhamer and others, 2003), the calibration was developed by combining water samples collected during each sensor deployment (including two samples from WY 2006). The near-bottom sonde was replaced on November 23, 2004, with a sonde from a different manufacturer. On May 18, 2005, the near-bottom sonde was determined to be reading erratically and was replaced. Because the two optical sensors (both YSI’s) deployed at the near-bottom position from November 23, 2004, through September 30, 2005, responded similarly to the uniform sediment characteristics of San Francisco Bay (Schoellhamer and others, 2003), the calibration was developed by combining water samples collected during each sensor deployment. The calculated SSC time-series data collected for WY 2005 are presented in figure 8.
PERIOD OF CALIBRATION.—
MID-DEPTH SENSOR: WY 2005 (fig. 9A).
NEAR-BOTTOM SENSOR: WY 2005 (fig. 9B).
NUMBER OF DATA POINTS (WATER SAMPLES) USED FOR CALIBRATION.—
MID-DEPTH SENSOR: 18 (17 from WY 2005).
NEAR-BOTTOM SENSOR: 27 (13 from WY 2005).
LINEAR REGRESSION EQUATION.—
MID-DEPTH SENSOR: SSC = 1.297 × NTU + 3.6.
NEAR-BOTTOM SENSOR: SSC = 1.173 × NTU + 8.8.
NONPARAMETRIC PREDICTION INTERVAL.—
MID-DEPTH SENSOR: +7 to -6 mg/L.
NEAR-BOTTOM SENSOR: +18 to -13 mg/L.
95-PERCENT CONFIDENCE INTERVAL ON SLOPE CALCULATION.—
MID-DEPTH SENSOR: 1.111 to 1.481.
NEAR-BOTTOM SENSOR: 1.035 to 1.333.
REMARKS.—Interruptions in record were caused by fouling or malfunction of the sensing and(or) recording instruments. The suspension cable failed on April 29, 2005, and was replaced on May 20, 2005. The near-bottom sonde malfunctioned during the site visit on August 18, 2005, and was replaced on September 7, 2005, with a sonde without a turbidity sensor. The calculated SSC time-series data collected for water year 2005 are presented in figure 10.
PERIOD OF CALIBRATION.—
MID-DEPTH SENSOR: WY 2005 (fig. 11).
NEAR-BOTTOM SENSOR (A): October 1, 2004, to March 29, 2005 (fig. 12A).
NEAR-BOTTOM SENSOR (B): March 29, 2005, through September 30, 2005 (fig. 12B).
NUMBER OF DATA POINTS (WATER SAMPLES) USED FOR CALIBRATION.—
MID-DEPTH SENSOR: 39 (19 from WY 2005).
NEAR-BOTTOM SENSOR (A): 7 (5 from WY 2005).
NEAR-BOTTOM SENSOR (B): 9 (9 from WY 2005).
LINEAR REGRESSION EQUATION.—
MID-DEPTH SENSOR: SSC = 0.640 × mV – 10.8.
NEAR-BOTTOM SENSOR (A): SSC = 0.919 × mV - 39.6.
NEAR-BOTTOM SENSOR (B): SSC = 0.633 × mV - 4.1.
NONPARAMETRIC PREDICTION INTERVAL.—
MID-DEPTH SENSOR: +13 to -8 mg/L.
NEAR-BOTTOM SENSOR (A): +20 to -24 mg/L.
NEAR-BOTTOM SENSOR (B): +13 to -22 mg/L.
95-PERCENT CONFIDENCE INTERVAL ON SLOPE CALCULATION.—
MID-DEPTH SENSOR: 0.573 to 0.685.
NEAR-BOTTOM SENSOR (A): 0.811 to 1.657.
NEAR-BOTTOM SENSOR (B): 0.303 to 0.848.
REMARKS.—Interruptions in record were caused by fouling or malfunction of the sensing and(or) recording instruments. The near-bottom optical sensor output began to drift in late January but the drift was not recognized until March 29, 2005, when the sensor was replaced with another optical sensor. The calculated SSC time-series data collected for WY 2005 are presented in figure 13.
PERIOD OF CALIBRATION.—
MID-DEPTH SENSOR: October 1, 2004 to September 28, 2005 (fig. 14).
NUMBER OF DATA POINTS (WATER SAMPLES) USED FOR CALIBRATION.—
MID-DEPTH SENSOR: 27 (11 from WY 2005).
LINEAR REGRESSION EQUATION.—
MID-DEPTH SENSOR: SSC = 1.787 × NTU + 1.9
NONPARAMETRIC PREDICTION INTERVAL.—
MID-DEPTH SENSOR: +19 to -14 mg/L.
95-PERCENT CONFIDENCE INTERVAL ON SLOPE CALCULATION.—
MID-DEPTH SENSOR (A): 1.111 to 2.031.
REMARKS.—Interruptions in record caused by fouling or malfunction of the sensing and(or) recording instruments. During periods of heavy fouling the optical sensor wiper was ineffective in keeping the optical ports clean because of biological growth on the wiper itself obscuring the optical ports. The site was discontinued on September 28, 2005. The calculated SSC time-series data collected for WY 2005 are presented in figure 15.
PERIOD OF CALIBRATION.—
MID-DEPTH SENSOR: WY 2005 (fig. 16A).
NEAR-BOTTOM SENSOR: WY 2005 (fig. 16B).
NUMBER OF DATA POINTS (WATER SAMPLES) USED FOR CALIBRATION.—
MID-DEPTH SENSOR: 29 (13 from WY 2005).
NEAR-BOTTOM SENSOR: 35 (15 from WY 2005).
LINEAR REGRESSION EQUATION.—
MID-DEPTH SENSOR: SSC = 1.755 × NTU + 0.9.
NEAR-BOTTOM SENSOR: SSC = 1.537 × NTU + 4.4.
NONPARAMETRIC PREDICTION INTERVAL.—
MID-DEPTH SENSOR: +14 to -10 mg/L.
NEAR-BOTTOM SENSOR: +25 to -10 mg/L.
95-PERCENT CONFIDENCE INTERVAL ON SLOPE CALCULATION.—
MID-DEPTH SENSOR: 1.330 to 2.213.
NEAR-BOTTOM SENSOR: 1.166 to 1.931.
REMARKS.—Interruptions in record were caused by fouling or malfunction of the sensing and(or) recording instruments. The mid-depth sonde was removed on June 28, 2005, because of a broken communication pin and redeployed on July 21, 2005. The near-bottom sonde was removed on June 7, 2005, because of a flooded battery compartment and a replacement sonde was deployed on June 9, 2005. Because the two optical sensors deployed at the near-bottom position responded similarly to the uniform sediment characteristics of San Francisco Bay (Schoellhamer and others, 2003), the calibration was developed by combining water samples collected during each sensor deployment.The calculated SSC time-series data collected for WY 2005 are presented in figure 17.
PERIOD OF CALIBRATION.—
MID-DEPTH SENSOR: WY 2005 (fig. 18).
NUMBER OF DATA POINTS (WATER SAMPLES) USED FOR CALIBRATION.—
MID-DEPTH SENSOR: 17 (17 from WY 2005).
LINEAR REGRESSION EQUATION.—
MID-DEPTH SENSOR: SSC = 2.357 × NTU - 8.4.
NONPARAMETRIC PREDICTION INTERVAL.—
MID-DEPTH SENSOR: +9 to -4 mg/L.
95-PERCENT CONFIDENCE INTERVAL ON SLOPE CALCULATION.—
MID-DEPTH SENSOR: 1.538 to 4.286.
REMARKS.—Interruptions in record caused by fouling or malfunction of the sensing and(or) recording instruments. The optical sensor wiper was ineffective during periods of heavy fouling because of biological growth on the wiper obscuring the optical ports. The calculated SSC time-series data collected for WY 2005 are presented in figure 19.
PERIOD OF CALIBRATION.—
MID-DEPTH SENSOR: WY 2005 (fig. 20A).
NEAR-BOTTOM SENSOR: October 1, 2004 to July 22, 2005 (fig. 20B).
NUMBER OF DATA POINTS (WATER SAMPLES) USED FOR CALIBRATION.—
MID-DEPTH SENSOR: 70 (16 from WY 2005).
NEAR-BOTTOM SENSOR: 57 (10 from WY 2005).
LINEAR REGRESSION EQUATION.—
MID-DEPTH SENSOR: SSC = 0.445 × mV + 5.2.
NEAR-BOTTOM SENSOR: SSC = 0.591 × mV + 1.8.
NONPARAMETRIC PREDICTION INTERVAL.—
MID-DEPTH SENSOR: +10 to -12 mg/L.
NEAR-BOTTOM SENSOR: +9 to -9 mg/L.
95-PERCENT CONFIDENCE INTERVAL ON SLOPE CALCULATION.—
MID-DEPTH SENSOR: 0.435 to 0.656.
NEAR-BOTTOM SENSOR: 0.509 to 0.720.
REMARKS.— Interruptions in record were caused by fouling or malfunction of the sensing and(or) recording instruments. Biological fouling in South San Francisco Bay is extreme, especially during the summer months, resulting in a fragmented data set. The near-bottom sensor malfunctioned on July 22, 2005, and a replacement sensor was deployed on July 27, 2005. The near-bottom sensor deployed from July 27, 2005 through September 30, 2005, did not operate properly and the data were deleted. The calculated SSC time-series data collected for WY 2005 are presented in figure 21.
PERIOD OF CALIBRATION.—
MID-DEPTH SENSOR (A): October 1, 2004, to July 28, 2005 (fig. 22A).
MID-DEPTH SENSOR (B): July 28, 2005, through September 30, 2005 (fig. 22B).
NEAR-BOTTOM SENSOR (A): October 1, 2004, to March 30, 2005 (fig. 23A).
NEAR-BOTTOM SENSOR (B): March 30, 2005, to July 28, 2005 (fig. 23B).
NEAR-BOTTOM SENSOR (C): July 28, 2005, through September 30, 2005 (fig. 23C).
NUMBER OF DATA POINTS (WATER SAMPLES) USED FOR CALIBRATION.—
MID-DEPTH SENSOR (A): 49 (9 from WY 2005).
MID-DEPTH SENSOR (B): 12 (4 from WY 2005, 8 from WY 2006).
NEAR-BOTTOM SENSOR (A): 16 (5 from WY 2005).
NEAR-BOTTOM SENSOR (B): 4 (4 from WY 2005).
NEAR-BOTTOM SENSOR (C): 12 (4 from WY 2005, 8 from WY 2006).
LINEAR REGRESSION EQUATION.—`
MID-DEPTH SENSOR (A): SSC = 0.629 × mV - 2.6.
MID-DEPTH SENSOR (B): SSC = 0.386 × NTU +14.5.
NEAR-BOTTOM SENSOR (A): SSC = 0.685 × mV - 13.8.
NEAR-BOTTOM SENSOR (B): SSC = 0.798 × mV - 14.4.
NEAR-BOTTOM SENSOR (C): SSC = 0.803 × NTU - 14.0.
NONPARAMETRIC PREDICTION INTERVAL.—
MID-DEPTH SENSOR (A): +9 to -9 mg/L.
MID-DEPTH SENSOR (B): +5 to -3 mg/L.
NEAR-BOTTOM SENSOR (A): +12 to -11 mg/L.
NEAR-BOTTOM SENSOR (B): Undeterminable with four samples.
NEAR-BOTTOM SENSOR (C): +8 to -7 mg/L.
95-PERCENT CONFIDENCE INTERVAL ON SLOPE CALCULATION.—
MID-DEPTH SENSOR (A): 0.562 to 0.742.
MID-DEPTH SENSOR (B): 0.133 to 0.990.
NEAR-BOTTOM SENSOR (A): 0.503 to 0.871.
NEAR-BOTTOM SENSOR (B): 0.094 to 1.667.
NEAR-BOTTOM SENSOR (C): 0.330 to 1.105.
REMARKS.—Interruptions in record were caused by fouling or malfunction of the sensing and(or) recording instruments. The mid-depth optical sensor was replaced with an optical sensor with wiper on July 28, 2005. The near-bottom optical sensor malfunctioned and was replaced on March 30, 2005. The near-bottom optical sensor was replaced with an optical sensor with wiper on July 28, 2005. The calculated SSC time-series data collected for WY 2005 are presented in figure 24.
PERIOD OF CALIBRATION.—
MID-DEPTH SENSOR (A): October 13, 2004, to April 20, 2005 (fig. 25A).
MID-DEPTH SENSOR (B): April 20, 2005, through September 30, 2005 (fig. 25B).
NEAR-BOTTOM SENSOR (A): October 1, 2004, to March 30, 2005 (fig. 26A).
NEAR-BOTTOM SENSOR (B): April 20, 2005, through September 30, 2005 (fig. 26B).
NUMBER OF DATA POINTS (WATER SAMPLES) USED FOR CALIBRATION.—
MID-DEPTH SENSOR (A): 8 (7 from WY 2005).
MID-DEPTH SENSOR (B): 7 (7 from WY 2005).
NEAR-BOTTOM SENSOR (A): 23 (7 from WY 2005).
NEAR-BOTTOM SENSOR (B): 16 (7 from WY 2005).
LINEAR REGRESSION EQUATION.—
MID-DEPTH SENSOR (A): SSC = 0.768 × NTU + 15.5.
MID-DEPTH SENSOR (B): SSC = 0.486 × mV + 4.3.
NEAR-BOTTOM SENSOR (A): SSC = 1.193 × NTU + 4.5.
NEAR-BOTTOM SENSOR (B): SSC = 0.620 × mV - 17.6.
NONPARAMETRIC PREDICTION INTERVAL.—
MID-DEPTH SENSOR (A): +3 to -12 mg/L.
MID-DEPTH SENSOR (B): +20 to -9 mg/L.
NEAR-BOTTOM SENSOR (A): +16 to -7 mg/L.
NEAR-BOTTOM SENSOR (B): +15 to -16 mg/L.
95-PERCENT CONFIDENCE INTERVAL ON SLOPE CALCULATION.—
MID-DEPTH SENSOR (A): -0.208 to 1.243.
MID-DEPTH SENSOR (B): 0.100 to 0.650.
NEAR-BOTTOM SENSOR (A): 0.889 to 1.491.
NEAR-BOTTOM SENSOR (B): 0.499 to 0.700.
REMARKS.—Interruptions in record were caused by fouling or malfunction of the sensing and(or) recording instruments. The mid-depth sonde was replaced with an optical sensor on April 20, 2005. The near-bottom sonde malfunctioned and was replaced on January 6, 2005. The near-bottom sonde malfunctioned on March 30, 2005 and was replaced with an optical sensor on April 20, 2005. Because the sondes optical sensors responded similarly to the uniform sediment characteristics of San Francisco Bay (Schoellhamer and others, 2003), the near-bottom calibration used from October 1, 2004, to March 30, 2005 was developed by combining water samples collected during each optical sensor deployment. The calculated SSC time-series data collected for WY 2005 are presented in figure 27.

![]() U.S. Department of the Interior | U.S. Geological Survey
U.S. Department of the Interior | U.S. Geological Survey
Persistent URL: https://pubs.water.usgs.gov/ds282
Page Contact Information: Publications Team
Page Last Modified: Monday, 28-Nov-2016 12:30:23 EST
