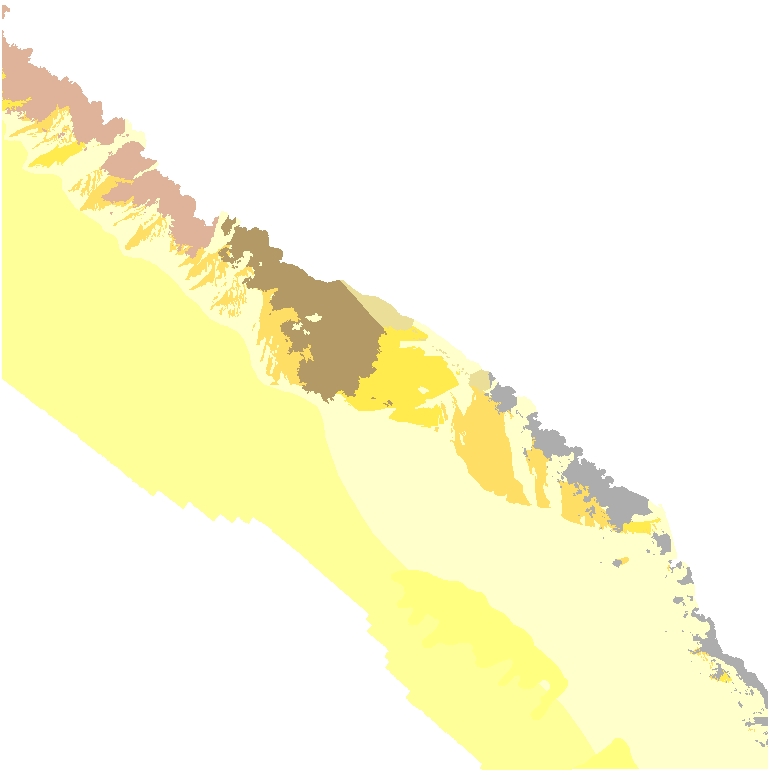
Geology and geomorphology--Offshore of Fort Ross Map Area, California

Metadata also available as - [Outline] - [Parseable text] - [XML]

Frequently anticipated questions:


What does this data set describe?

Title:
Geology and geomorphology--Offshore of Fort Ross Map Area, California
Abstract:
This part of DS 781 presents data for the geologic and geomorphic map of the Offshore of Fort Ross map area, California. The vector data file is included in "Geology_OffshoreFortRoss.zip," which is accessible from https://pubs.usgs.gov/ds/781/OffshoreFortRoss/data_catalog_OffshoreFortRoss.html.

The morphology and the geology of the offshore part of the Offshore of Fort Ross map area result from the interplay between local sedimentary processes, oceanography, sea-level rise, and tectonics. The nearshore seafloor in the northern half of the map area is characterized by rocky outcrops of Tertiary sedimentary rocks (units Tgr and Tsm). This rugged nearshore zone and the inner shelf (to water depths of about 50 m) typically dip seaward about 1.5 to 2.5 degrees, whereas the mid-shelf within State Waters (about 50 to 85 m) dips more gently, about 0.4 degrees. In contrast, the nearshore to mid shelf in the southern half of the map area lies directly offshore of the mouth of the Russian River and has a more gentle, uniform dip, about 0.45 to 0.55 degrees, out to water depths of about 70 m at the outer limit of State Waters. A significant amount of the Russian River sediment load, estimated at about 900,000 metric tons/yr by Farnsworth and Warrick (2007) is deposited offshore of the river mouth, contributing to the noted north-to-south contrast in bathymetric slope. On a larger geomorphic scale, sea level has risen about 125 to 130 m over about the last 21,000 years (for example, Lambeck and Chappell, 2001; Peltier and Fairbanks, 2005), leading to broadening of the continental shelf, progressive eastward migration of the shoreline and wave-cut platform, and associated transgressive erosion and deposition. Tectonic influences impacting shelf geomorphology and geology are primarily related to the active San Andreas Fault system (see below).

Given exposure to high wave energy, modern nearshore to inner-shelf sediments north of the mouth of the Russian River are mostly sand (unit Qms) and a mix of sand, gravel, and cobbles (units Qmsc and Qmsd). The more coarse-grained sands and gravels (units Qmsc and Qmsd) are primarily recognized on the basis of bathymetry and high backscatter. Both Qmsc and Qmsd typically have abrupt landward contacts with bedrock (units Tgr, Tsm, Tkfs, fsr) and form irregular to lenticular exposures that are commonly elongate in the shore-normal direction. Contacts between units Qmsc and Qms are typically gradational. Unit Qmsd forms erosional lags in scoured depressions that are bounded by relatively sharp and less commonly diffuse contacts with unit Qms horizontal sand sheets. These depressions are typically a few tens of centimeters deep and range in size from a few 10's of sq m to more than one sq km.

Similar Qmsd scour depressions are common along this stretch of the California coast (see, for example, Cacchione and others, 1984; Hallenbeck and others, 2012) where surficial offshore sandy sediment is relatively thin (thus unable to fill the depressions) due to both lack of sediment supply and to erosion and transport of sediment during large northwest winter swells. Such features have been referred to as "rippled-scour depressions" (see, for example, Cacchione and others, 1984) or "sorted bedforms" (see, for example, Goff and others, 2005; Trembanis and Hume, 2011). Although the general areas in which both Qmsd scour depressions and surrounding mobile sand sheets occur are not likely to change substantially, the boundaries of the individual Qmsd depressions are likely ephemeral, changing seasonally and during significant storm events.

Unit Qmsf lies offshore of unit Qms, and consists primarily of mud and muddy sand and is commonly extensively bioturbated. The water depth of the transition from sand-dominated marine sediment (unit Qms) to mud-dominated marine sediment (Qmsf) increases from about 45 to 50 m directly offshore of the mouth of the Russian River to as much as about 60 m adjacent to the rocky outcrops along the northern map boundary. This change is clearly related to the large amount of fine sediment load carried by the Russian River, which feeds a widespread, mid-shelf, mud belt that extends along the mid-shelf from Point Arena to Point Reyes (Klise, 1983; Drake and Cacchione, 1985; Demirpolat, 1991).

Map unit polygons were digitized over underlying 2-meter base layers developed from multibeam bathymetry and backscatter data (see Bathymetry--Offshore Fort Ross, California and Backscattter A to C--Offshore Fort Ross, California, DS 781, for more information). The bathymetry and backscatter data were collected between 2006 and 2009.

References Cited

Cacchione, D.A., Drake, D.E., Grant, W.D., and Tate, G.B., 1984, Rippled scour depressions of the inner continental shelf off central California: Journal of Sedimentary Petrology, v. 54, p. 1,280-1,291.

Demirpolat, S., 1991, Surface and near-surface sediments from the continental shelf off the Russian River, northern California: Marine Geology, v. 99, p. 163-173.

Drake, D.E., and Cacchione, D.A., 1985, Seasonal variation in sediment transport on the Russian River shelf, California: Continental Shelf Research, v. 14, p. 495-514.

Farnsworth, K.L., and Warrick, J.A., 2007, Sources, dispersal, and fate of fine sediment supplied to coastal California: U.S. Geological Survey Scientific Investigations Report 2007-5254, 77 p.

Goff, J.A., Mayer, L.A., Traykovski, P., Buynevich, I., Wilkens, R., Raymond, R., Glang, G., Evans, R.L., Olson, H., and Jenkins, C., 2005, Detailed investigations of sorted bedforms or "rippled scour depressions", within the Martha’s Vineyard Coastal Observatory, Massachusetts: Continental Shelf Research, v. 25, p. 461-484.

Hallenbeck, T.R., Kvitek, R.G., and Lindholm, J., 2012, Rippled scour depressions add ecologically significant heterogeneity to soft-bottom habitats on the continental shelf: Marine Ecology Progress Series, v. 468, p. 119-133.

Klise, D.H., 1983, Modern sedimentation on the California continental margin adjacent to the Russian River: M.S. thesis, San Jose State University, 120 p.

Lambeck, K., and Chappell, J., 2001, Sea level change through the last glacial cycle: Science, v. 292, p. 679-686, doi: 10.1126/science.1059549.

Peltier, W.R., and Fairbanks, R.G., 2005, Global glacial ice volume and Last Glacial Maximum duration from an extended Barbados sea level record: Quaternary Science Reviews, v. 25, p. 3,322-3,337.

Trembanis, A.C., and Hume, T.M., 2011, Sorted bedforms on the inner shelf off northeastern New Zealand-Spatiotemporal relationships and potential paleo-environmental implications: Geo-Marine Letters, v. 31, p. 203-214.
Supplemental_Information:

Map political location: San Mateo County, California Compilation scale: 1:24,000 Base maps used are hillshades generated from IfSAR, LiDAR, and multibeam mapping both onshore and offshore (see Bathymetry--Offshore of Fort Ross Map Area, California).
  1. How might this data set be cited?
    Johnson, S.Y., Hartwell, S.R., and Manson, M.W., 2014, Geology and geomorphology--Offshore of Fort Ross Map Area, California:.

    This is part of the following larger work.

    Johnson, Samuel Y., Dartnell, Peter, Golden, Nadine E., Hartwell, Stephan R., Greene, H. Gary, Erdey, Mercedes D., Cochrane, Guy R., Watt, Janet L., Kvitek, Rikk G., Manson, Michael W., Endris, Charles A., Dieter, Bryan E., Krigsman, Lisa M., Sliter, Ray W., Lowe, Erik N., and Chin, John L., 2015, California State Waters Map Series—Offshore of Fort Ross, California: Open-File Report OFR 2015–1211, U.S. Geological Survey, Reston, VA.

    Online Links:

  2. What geographic area does the data set cover?
    West_Bounding_Coordinate: -123.31
    East_Bounding_Coordinate: -123.10
    North_Bounding_Coordinate: 38.56
    South_Bounding_Coordinate: 38.40
  3. What does it look like?
    <https://pubs.usgs.gov/ds/781/OffshoreFortRoss/images/Geology_OffshoreFortRoss.jpg> (JPEG)
    Geology offshore Fort Ross.
  4. Does the data set describe conditions during a particular time period?
    Beginning_Date: 2006
    Ending_Date: 2009
    Currentness_Reference: ground condition
  5. What is the general form of this data set?
    Geospatial_Data_Presentation_Form: vector digital data
  6. How does the data set represent geographic features?
    1. How are geographic features stored in the data set?
      This is a Vector data set. It contains the following vector data types (SDTS terminology):
      • GT-polygon composed of chains (322)
    2. What coordinate system is used to represent geographic features?
      The map projection used is WGS 1984 UTM Zone 10N.
      Projection parameters:
      Scale_Factor_at_Central_Meridian: 0.9996
      Longitude_of_Central_Meridian: -123.0
      Latitude_of_Projection_Origin: 0.0
      False_Easting: 500000.0
      False_Northing: 0.0
      Planar coordinates are encoded using coordinate pair
      Abscissae (x-coordinates) are specified to the nearest 0.0001
      Ordinates (y-coordinates) are specified to the nearest 0.0001
      Planar coordinates are specified in Meter
      The horizontal datum used is D WGS 1984.
      The ellipsoid used is WGS 1984.
      The semi-major axis of the ellipsoid used is 6378137.0.
      The flattening of the ellipsoid used is 1/298.257223563.
  7. How does the data set describe geographic features?
    MapUnitPolys
    Polygons representing geologic / geomorphic map units (Source: This report)
    FID
    Internal feature number. (Source: ESRI) Sequential unique whole numbers that are automatically generated.
    Shape
    Feature geometry. (Source: ESRI) Coordinates defining the features.
    MapUnitAbb
    Map Unit abbreviation (Source: This report)
    ValueDefinition
    QmsMarine nearshore and shelf deposits
    QmsdMarine shelf scour depressions
    QmscCoarse-grained marine nearshore and shelf deposits
    QmsfFine-grained marine shelf deposits
    QmslMarine mid-shelf sediment lobes
    TsmSandstone and mudstone of the Fort Ross area
    TgrGerman Rancho Formation
    TKfsFranciscan Complex, sandstone within the Coastal or Central belt
    fsrFranciscan Complex, mélange in Central belt
    Shape_Area
    Area of feature in internal units squared. (Source: ESRI) Positive real numbers that are automatically generated.

Who produced the data set?

  1. Who are the originators of the data set? (may include formal authors, digital compilers, and editors)
  2. Who also contributed to the data set?
  3. To whom should users address questions about the data?
    USGS Pacific Coastal and Marine Science Center
    Attn: Stephen Hartwell
    Geologist
    400 Natural Bridges Drive
    Santa Cruz, CA
    USA

    (831) 460-7814 (voice)
    (831) 427-4748 (FAX)
    shartwell@usgs.gov

Why was the data set created?

To expand geologic mapping to the seafloor within the California's State Waters, to update coastal geologic mapping, and to contribute to a uniform regional geologic database, which can be used geographic information systems. Additionally, to provide a geologic map for the public and geoscience community to aid in assessments and mitigation of geologic hazards in the Fort Ross coastal region and to provide sufficient geologic information for land-use and land-management decisions both onshore and offshore. This information is not intended for navigational purposes.

How was the data set created?

  1. From what previous works were the data drawn?
    Bathymetry--Offshore of Fort Ross (source 1 of 3)
    Bretz, Carrie K., Kvitek, Rikk G., Dartnell, Peter, and Phillips, Eleyne L., 2014, Bathymetry--Offshore of Fort Ross Map Area, California: Scientific Data Series DS 781, U.S. Geological Survey, Reston, VA.

    Online Links:

    Other_Citation_Details:
    See metadata for bathymetry ("Bathymetry_OffshoreFortRoss_metadata.txt") in DS 781 for source data and postprocessing/reprocessing information.
    Type_of_Source_Media: digital file of gridded bathymetry data (ArcInfo GRID)
    Source_Contribution: Gridded bathymetry data (2-meter resolution).
    Backscatter--Offshore of Fort Ross (source 2 of 3)
    Bretz, Carrie K., Kvitek, Rikk G., Dartnell, Peter, and Phillips, Eleyne L., 2014, Backscatter--Offshore of Fort Ross Map Area, California: Scientific Data Series DS 781, U.S. Geological Survey, Reston, VA.

    Online Links:

    Other_Citation_Details:
    See metadata for Backscatter ("BackscatterA_8101_OffshoreFortRoss_metadata.txt", "BackscatterB_7125_OffshoreFortRoss_metadata.txt", and "BackscatterC_Swath_OffshoreFortRoss_metadata.txt") in DS 781 for amplitude source data and postprocessing/reprocessing information.
    Type_of_Source_Media: digital file of gridded amplitude data (ArcInfo GRID)
    Source_Contribution: Gridded amplitude data (2-meter resolution).
    S-8-09-NC (source 3 of 3)
    U.S. Geological Survey (USGS) , Coastal and Marine Geology Program (CMGP), 2013, Subbottom survey data of field activity S-8-09-NC in Stinson Beach to Point Arena (CA) from 09/08/2009 to 09/30/2009: U.S. Geological Survey (USGS) , Coastal and Marine Geology (CMG), Menlo Park, CA.

    Online Links:

    Type_of_Source_Media: ASCII lat/long shot point files
    Source_Contribution:
    Digital seismic data used to interpret subsurface geologic structure
  2. How were the data generated, processed, and modified?
    Date: 2013 (process 1 of 3)
    Faults were mapped onto shot lines based on the latitude and longitude of seismic picks from field activity S-8-09-NC.
    Date: 2012 (process 2 of 3)
    Map unit polygons were digitized over underlying 2-meter base layers developed from multibeam bathymetry and backscatter data. Derivatives such as slope and curvature were generated from source rasters. Interpreted rasters include amplitude, hillshaded bathymetry (using various illumination angles and vertical exaggeration), slope, and curvature. Curvature was decomposed into profile and plan curvature for analysis purposes.
    Date: 2013 (process 3 of 3)
    The mapped area was extended to the shoreline by using digital orthophotos to interpret the region between the inner edge of the multibeam bathymetry and the approximate shoreline. The approximate shoreline was generated at the NAVD88 +1.46 m contour, defined as the operational MHW shoreline by Weber and others (2005). The resulting boundary was transformed to WGS 84 UTM Zone 10 North in ArcGIS 10 using the NAD83 to WGS84 (ITRF00) transformation algorithm. This boundary was then used to extend and trim both onshore and offshore geology in the print and PDF product. The transformed boundary is contained within the WGS84 "contours" feature class and identified as a water boundary in the associated representation rules.
    References Cited:

    Blake, M.C., Jr., Graymer, R.W., and Stamski, R.E., 2002, Geologic map and map database of western Sonoma, northernmost Marin, and southernmost Mendocino counties, California: U.S. Geological Survey Miscellaneous Field Studies Map 2402, scale 1:100,000.

    California Geological Survey, 1974, Alquist-Priolo Earthquake Fault Zone Maps of Arched Rock, Fort Ross and Plantation quadrangles, scale 1:24,000.

    Huffman, M.E., 1972, Geology for planning on the Sonoma County coast between the Russian and Gualala Rivers: California Division of Mines and Geology Preliminary Report 16, 38 p., 4 plates, scale 1:24,000.

    Klise, D.H., 1983, Modern sedimentation on the California continental margin adjacent to the Russian River: M.S. thesis, San Jose State University, 120 p.

    Manson, M.W., Huyette, C.M., Wills, C.J., Huffman, M.E., Smelser, M.G., Fuller, M.E., Domrose, C., and Gutierrez, C., 2006, Landslides in the Highway 1 corridor between Bodega Bay and Fort Ross, Sonoma County, California: California Geological Survey Special Report 196, 26 p., 2 plates, 38 maps, scale 1:12,000.

    Wagner, D.L., and Gutierrez, C.I., 2010, Preliminary Geologic Map of the Napa 30’ x 60’ Quadrangle, California: California Geological Survey, scale 1:100,000.

    Wagner and Gutierrez, in press, Preliminary Geologic Map of the Bodega Bay 30’ x 60’ Quadrangle, California: California Geological Survey, scale 1:100,000.

    Weber, K.M., List, J.H., and Morgan, K.L., 2005, An operational Mean High Water datum for determination of shoreline position from topographic lidar data: U.S. Geological Survey Open-File Report 2005-1027, accessed April 5, 2011, at https://pubs.usgs.gov/of/2005/1027/.

    Witter, R.C., Knudsen, K.L., Sowers, J.M., Wentworth, C.M., Koehler, R.D., Randolph, C.E., Brooks, S.K., and Gans, K.D., 2006, Maps of Quaternary Deposits and Liquefaction Susceptibility in the Central San Francisco Bay Region, California, U.S. Geological Survey Open-File Report 06-1037, scale 1:24,000.
  3. What similar or related data should the user be aware of?

How reliable are the data; what problems remain in the data set?

  1. How well have the observations been checked?
  2. How accurate are the geographic locations?
    Polygons were primarily mapped by one of the following methods: (1) interpretation of 2-meter-resolution hillshaded bathymetry data from bathymetric lidar and sonar surveys (see Bathymetry--Offshore of Fort Ross Map Area, California); (2) interpretation of 2-meter-resolution amplitude (backscatter) data from bathymetric sonar surveys (see Backscatter--Offshore of Fort Ross Map Area, California); (3) interpretation of 2-meter interpretation of seismic-reflection-profile data (see field activity S-8-09-NC).
    Map Unit contact locations were interpreted typically at a scale of between 1:1,000 and 1:2,000 using the above base data. Bathymetric sonar and LiDAR data have a horizontal accuracy greater than the resolution of the base data.
    Map unit contacts were digitized by heads-up screen digitization of line data on 2-meter-resolution DEMs described above. Horizontal accuracy is estimated to be between 2 and 5 meters depending on how clearly contacts can be resolved.
    Most digitized positions on the map are estimated to have better than 5 m horizontal accuracy. There is no elevation data in the database.
  3. How accurate are the heights or depths?
  4. Where are the gaps in the data? What is missing?
    Data are complete: no offshore features that could be accurately identified and represented at the compilation scale of 1:24,000 were eliminated or generalized. The smallest area represented is approximately 100 square meters. All geospatial database elements are attributed.
  5. How consistent are the relationships among the observations, including topology?
    Map elements were visually checked for overshoots, undershoots, duplicate features, polygon closure, and other errors by the lead authors and by the GIS technician(s) who created the digital database. Review drafts of the map were reviewed internally by at least two other geologists for consistency with basic geologic principles and general conformity to USGS mapping standards.

How can someone get a copy of the data set?

Are there legal restrictions on access or use of the data?
Access_Constraints:
If physical samples or materials are available, constraints on their on-site access are described in "WR CMG Sample Distribution Policy" at URL: http://walrus.wr.usgs.gov/infobank/programs/html/main/sample-dist-policy.html
Use_Constraints:
This information is not intended for navigational purposes.
Read and fully comprehend the metadata prior to data use. Uses of these data should not violate the spatial resolution of the data. Where these data are used in combination with other data of different resolution, the resolution of the combined output will be limited by the lowest resolution of all the data.
Acknowledge the U.S. Geological Survey in products derived from these data. Share data products developed using these data with the U.S. Geological Survey.
This database has been approved for release and publication by the Director of the USGS. Although this database has been subjected to rigorous review and is substantially complete, the USGS reserves the right to revise the data pursuant to further analysis and review. Furthermore, it is released on condition that neither the USGS nor the United States Government may be held liable for any damages resulting from its authorized or unauthorized use.
Although this Federal Geographic Data Committee-compliant metadata file is intended to document these data in nonproprietary form, as well as in ArcInfo format, this metadata file may include some ArcInfo-specific terminology.

Who wrote the metadata?

Dates:
Last modified: 2013
Last Reviewed: 22-Sep-2014
Metadata author:
U.S. Geological Survey, Coastal and Marine Geology Program
Attn: Stephen R. Hartwell
400 Natural Bridges Drive
Santa Cruz, CA
US

831-460-7814 (voice)
831-427-4748 (FAX)
shartwell@usgs.gov
Metadata standard:
FGDC Content Standard for Digital Geospatial Metadata (FGDC-STD-001-1998)

Generated by mp version 2.9.32 on Mon Nov 23 10:10:43 2015