Dartnell, Peter, and Kvitek, Rikk G., 2014, Bathymetry--Offshore of Salt Point Map Area, California:.This is part of the following larger work.
Johnson, Samuel Y., Dartnell, Peter, Golden, Nadine E., Hartwell, Stephen R., Greene, H. Gary, Erdey, Mercedes D., Cochrane, Guy R., Kvitek, Rikk G., Manson, Michael W., Endris, Charles A., Dieter, Bryan E., Watt, Janet T., Krigsman, Lisa M., Sliter, Ray W., Lowe, Erik N., and Chin, John L., 2015, California State Waters Map Series--Offshore of Salt Point map area, California: Open-File Report OFR 2015-1098, U.S. Geological Survey, Reston, VA.Online Links:
This is a Raster data set. It contains the following raster data types:
Planar coordinates are encoded using coordinate pair
Abscissae (x-coordinates) are specified to the nearest 2.0
Ordinates (y-coordinates) are specified to the nearest 2.0
Planar coordinates are specified in Meters
The horizontal datum used is NAD83.
The ellipsoid used is GRS80.
The semi-major axis of the ellipsoid used is 6378137.00 meters.
The flattening of the ellipsoid used is 1/298.257223563.
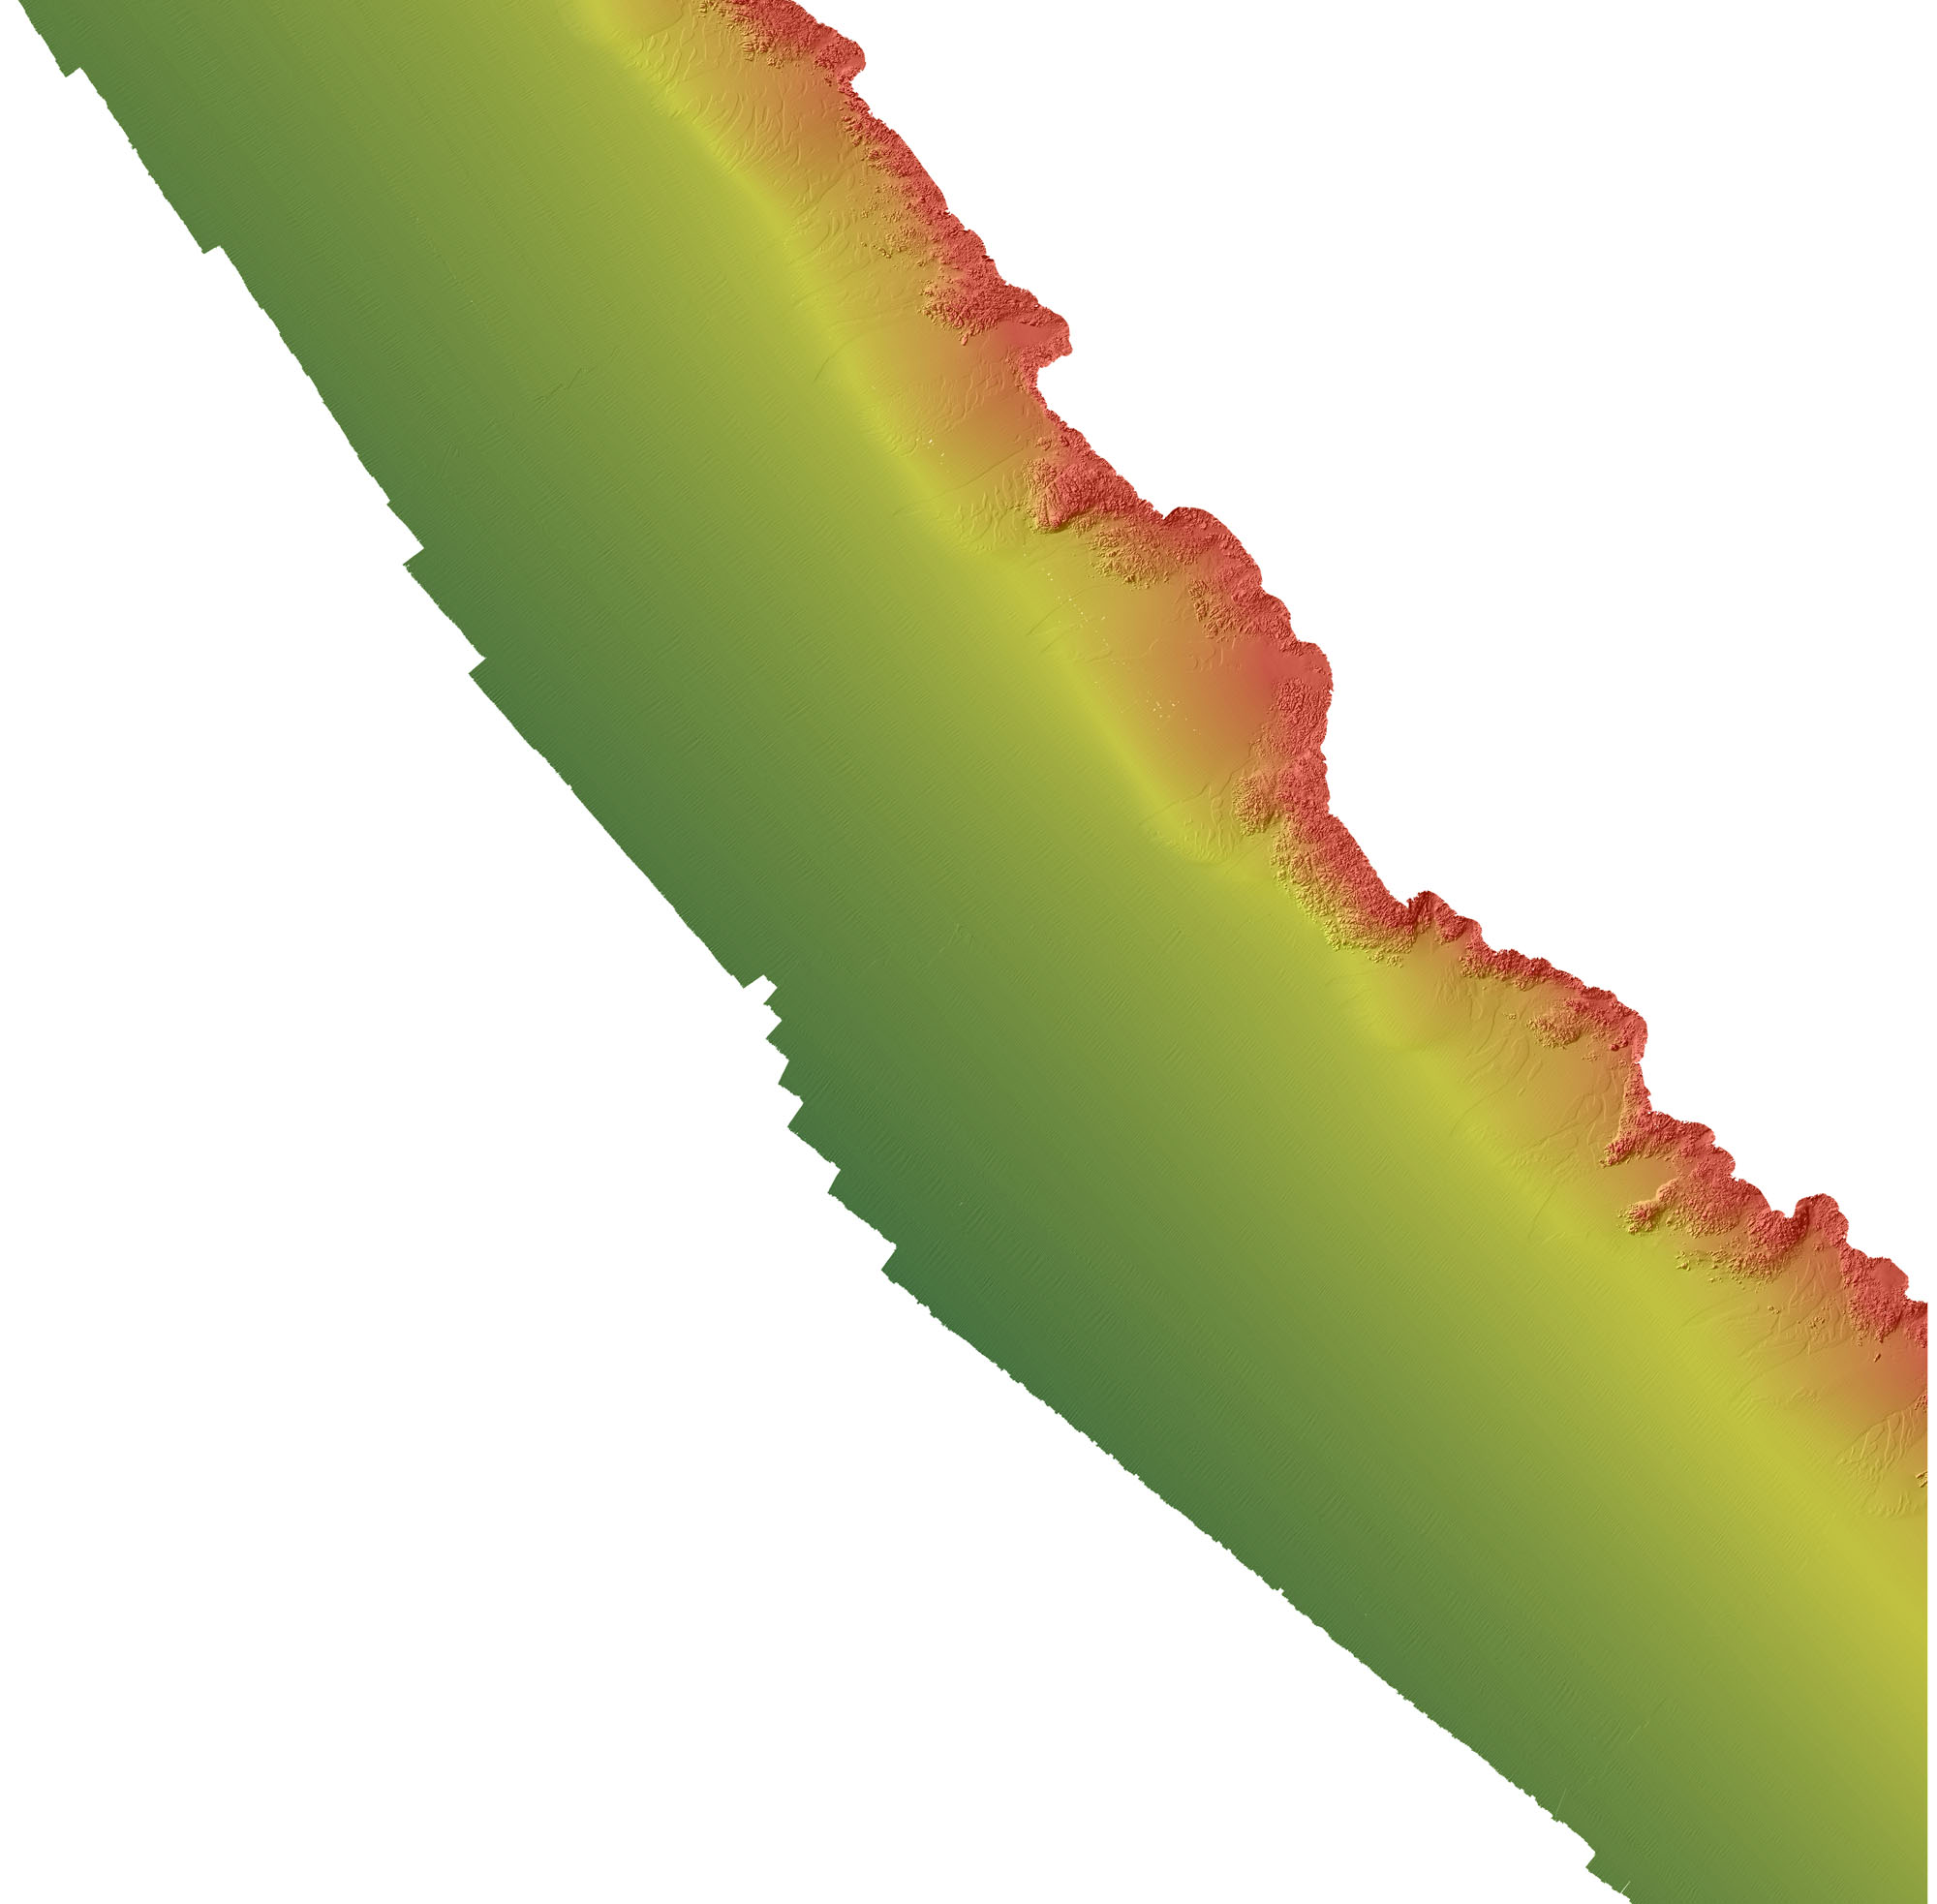
Cell size = 2.0
Number of rows = 8860
Number of columns = 8870

Data type = floating point

Boundary
Xmin = 473360
Xmax = 491100
Ymin = 4249860
Ymax = 4267580

Statistics
Minimum value = -88.45
Maximum value = -2.19
Mean = -46.74
Standard deviation = 20.19

Coordinate system description
Projection  UTM
Zone  10
Datum  NAD83
Vertical Datum  NAVD88
Units  meter
| Range of values | |
|---|---|
| Minimum: | -97.47 |
| Maximum: | 2.19 |
| Units: | meters |
(831) 460-7415 (voice)
(831) 427-4709 (FAX)
pdartnell@usgs.gov
To expand geologic mapping to the seafloor within the California's State Waters, to update coastal geologic mapping, and to contribute to a uniform regional geologic database, which can be used geographic information systems. Additionally, to provide a geologic map for the public and geoscience community to aid in assessments and mitigation of geologic hazards in the Point Reyes coastal region and to provide sufficient geologic information for land-use and land-management decisions both onshore and offshore. This information is not intended for navigational purposes.
Person who carried out this activity:
(831) 582-4197 (voice)
cbretz@csumb.edu
Person who carried out this activity:
(831) 460-7415 (voice)
pdartnell@usgs.gov
Person who carried out this activity:
(831) 460-7415 (voice)
pdartnell@usgs.gov
Not applicable for raster data.
Horizontal_Positional_Accuracy_Report: Estimated to be no less than 2 m, owing to water depth and total propagated uncertainties of the mapping systems, which include sonar system, position and motion compensation system, and navigation, as well as data processing that includes sounding cleaning, gridding, and datum transformations.
Vertical_Positional_Accuracy_Report: Estimated to be no less than 20 cm, owing to water depth and total propagated uncertainties of the mapping systems, which include sonar system, position and motion compensation system, and navigation, as well as data processing that includes sounding cleaning, gridding, and datum transformations.
Complete
Unspecified
Are there legal restrictions on access or use of the data?
- Access_Constraints:
- If physical samples or materials are available, constraints on their on-site access are described in "WR CMG Sample Distribution Policy" at URL: <http://walrus.wr.usgs.gov/infobank/programs/html/main/sample-dist-policy.html>
- Use_Constraints:
- This information is not intended for navigational purposes.
This database has been approved for release and publication by the Director of the USGS. Although this database has been subjected to rigorous review and is substantially complete, the USGS reserves the right to revise the data pursuant to further analysis and review. Furthermore, it is released on condition that neither the USGS nor the United States Government may be held liable for any damages resulting from its authorized or unauthorized use.
USGS-authored or produced data and information are in the public domain. Acknowledge the U.S. Geological Survey and California State University, Monterey Bay, Seafloor Mapping Lab in products derived from these data. Share data products developed using these data with the U.S. Geological Survey.
This information is not intended for navigational purposes. Read and fully comprehend the metadata prior to data use. Uses of these data should not violate the spatial resolution of the data. Where these data are used in combination with other data of different resolution, the resolution of the combined output will be limited by the lowest resolution of all the data.
Although this Federal Geographic Data Committee-compliant metadata file is intended to document these data in nonproprietary form, as well as in ArcInfo format, this metadata file may include some ArcInfo-specific terminology.
(650) 329-4309 (voice)
These databases, identified as bathymetry and shaded-relief maps of Offshore of Salt Point Map Area, California have been approved for release and publication by the U.S. Geological Survey (USGS). Although these databases have been subjected to rigorous review and are substantially complete, the USGS reserves the right to revise the data pursuant to further analysis and review. Furthermore, it is released on condition that neither the USGS nor the United States Government may be held liable for any damages resulting from its authorized or unauthorized use.
Although these data have been processed successfully on a computer system at the U.S. Geological Survey (USGS), no warranty expressed or implied is made regarding the display or utility of the data on any other system or for general or scientific purposes, nor shall the act of distribution constitute any such warranty. The USGS or the U.S. Government shall not be held liable for improper or incorrect use of the data described and/or contained herein.
Reference herein to any specific commercial product, process, or service by trade name, trademark, manufacturer, or otherwise does not constitute or imply its endorsement, recommendation, or favoring by the United States Government or any agency thereof.
These data are not intended for navigational use.
| Data format: | The .zip file for the TIFF image includes the image (.tif), the world registration file (.tfw), and the text (.txt) and XML (.tif.xml) versions of the metadata for the Bathymetry data layer of Offshore Salt Point, California. in format TIFF (version ArcMap (version 10.0, ESRI , 2011)) Raster data layer is registered TIFF image in the UTM Zone 10 coordinate system with datum NAD83. Size: 15.5 |
|---|---|
| Network links: |
<https://pubs.usgs.gov/ds/781/OffshoreSaltPoint/data/Bathymetry_OffshoreSaltPoint.zip> <https://pubs.usgs.gov/ds/781/> |
The downloadable data file has been compressed with the "zip" command and can be unzipped with Winzip (or other tool) on Windows systems. To utilize these data, the user must have software capable of uncompressing the WinZip file and importing and viewing an Esri ArcMap TIFF. Users should download the ArcGIS Project File, OffshoreSaltPointGIS.mxd.zip, a compressed (with the "zip" command) version of the ArcMap document (.mxd) that has all the data layers loaded in the table of contents for "Offshore Salt Point" and has all the data symbolized as on the data release map sheets. Download and save this ArcGIS project file, including all data layers, to the directory the user has created for this GIS.
(831) 460-7415 (voice)
(831) 427-4709 (FAX)
pdartnell@usgs.gov