Earthquake probabilities are only one component in the evaluation of earthquake
hazard and risk. Local soil conditions, bedrock type, quality of construction,
susceptibility to earthquake-induced ground failures or flooding (caused by
dam or levee failure) can all profoundly affect the possibility of damage at
a particular site in an earthquake. This was dramatically demonstrated by the
1989 Loma Prieta earthquake, which devastated vulnerable parts of Oakland and
San Francisco more than 50 miles from the fault rupture.
WG02 has examined possible earthquake scenarios on all of the major Bay region
faults and assigned probabilities to the occurrence of these events over the
next 30 years. A next step in hazard assessment is the estimation of intensity
of ground shaking from each such scenario earthquake, taking into account the
location, length, and magnitude of the anticipated rupture and the ground conditions
(bedrock and soil types) at various locations around the Bay region. For example,
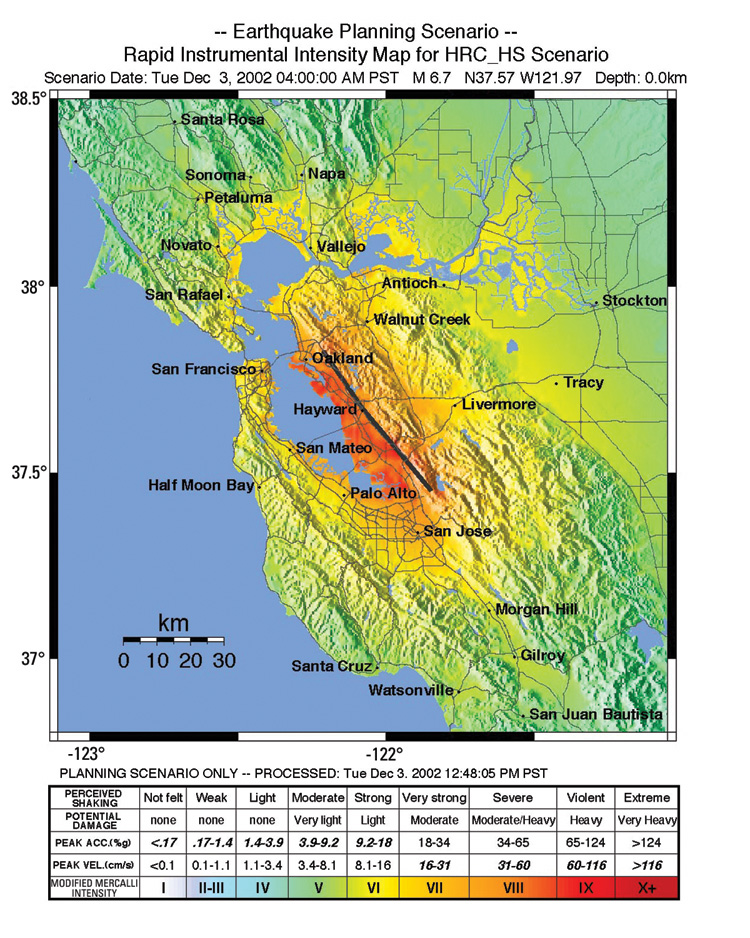
a shock on the southern Hayward Fault, which last ruptured in 1868 in an earthquake
of magnitude about 6.9, would produce damaging shaking over a wide area.
|
|
|
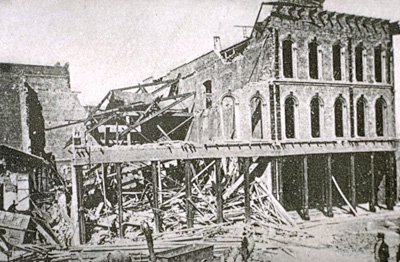
This “ShakeMap” (above) shows the shaking intensities expected for a hypothetical scenario earthquake (magnitude 6.7) on the southern Hayward Fault, which last ruptured in 1868 in an event of magnitude about 6.9. Note that damaging shaking would occur over a wide tract and be especially severe around the margins of the Bay in areas underlain by bay mud. The 1868 shock destroyed a number of buildings in San Francisco. The photo on the left shows one wrecked building in what is now San Francisco’s Financial District, mostly built on bay mud and artificial fill. (Photograph courtesy of the Karl V. Steinbrugge Collection, Earthquake Engineering Research Center, University of California, Berkeley.) |
The estimated distribution of shaking intensities in the Bay region from a
scenario event, combined with the probability of that event happening in a given
time period, yields an estimated frequency of occurrence of that distribution
of shaking intensities. By using such information from all anticipated scenario
ruptures in the region, an overall probability can be calculated that a location
will experience at least a given level of shaking within a specific time period,
say the expected lifetime of a building—a probability of considerable interest
to building designers and structural engineers.
| SHAKING INTENSITIES WITH 50% CHANCE OF BEING EXCEEDED IN THE NEXT 30 YEARS |
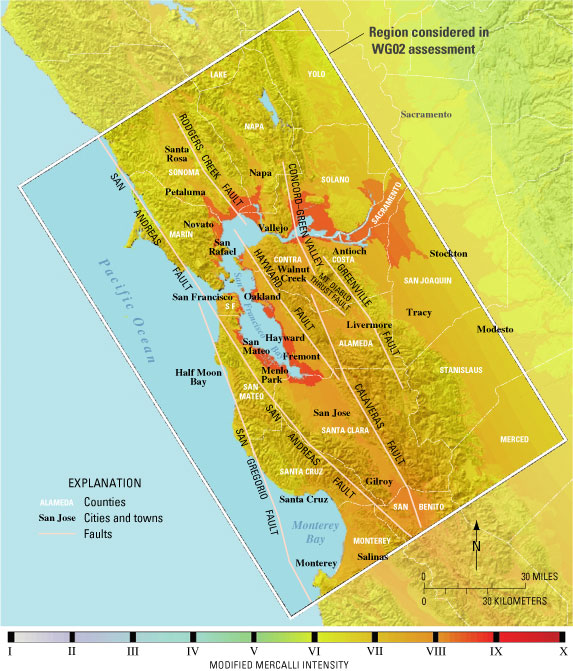 |
| This map, derived by combining the predicted frequencies and intensities of shaking from all likely earthquake scenarios in the San Francisco Bay region, shows levels of shaking that have a 50% chance of being exceeded over the next 30 years.Most populated areas of the region have even odds of experiencing shaking of intensity VII or greater on the Modified Mercalli Intensity (MMI) scale, sufficient to cause moderate damage. Areas on soft soil, such as on the edges of the Bay, have even odds of experiencing MMI intensity VIII or greater, capable of causing serious structural damage. |
The final layer in the assessment of risk involves combining the level of hazard with the quantity and vulnerability of structures exposed to the hazard. The earthquake hazard has been shown to extend throughout the entire Bay region, but the local risk and potential loss depend on the exposure. A densely built urban area with an expectation of high shaking intensity is clearly at greater risk than an agricultural area with the same expected level of shaking. An analysis of potential earthquake losses in the Bay region conducted by the USGS and the California Geological Survey indicates that areas along the Hayward Fault have the highest likely proportional loss of any parts of the region. This high potential loss is the result of dense development directly along and adjacent to the Hayward Fault and the fact that earthquakes on the Hayward, though smaller than those on the San Andreas Fault, occur more frequently.
| next page |