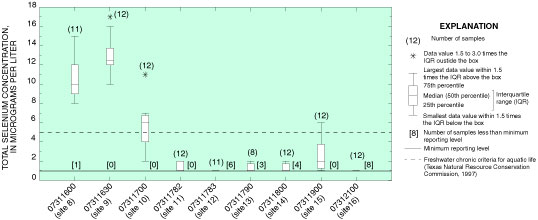
Figure 2. Distributions of total selenium concentrations at sites in the Wichita River Basin.
Back to Contents | Back to Text