The Wichita River Basin in northwest Texas (fig. 1) covers about 3,440 square miles (mi2) of the 94,500-mi2 Red River Basin. The drainage area above Lake Kemp (fig. 1) is 2,086 mi2. The Wichita River Basin is characterized by rolling plains and prairie with an average annual (1961–90) rainfall of 28.9 inches at Wichita Falls (population about 100,000), the largest city in the basin (Ramos, 1997). Cattle grazing and agriculture are predominant industries outside the Wichita Falls city limits. One of the earliest oil fields in Texas, the Electra oil field, is in the basin; although some oil is still being produced, oil field activity has decreased from the boom years of the 1920s–30s. The surface-water supply in this basin generally is of poor quality—dissolved solids concentrations vary from slightly saline (1,000 to 3,000 milligrams per liter (mg/L)) to very saline (10,000 to 35,000 mg/L).
The Wichita River Basin is the first of five reaches of the Red River Basin (within Texas) to be monitored for compliance with the Clean Waters Act of 1991 (Texas Senate Bill 818) (Baldys and Phillips, 1997). Water quality in the Wichita River Basin is influenced by salt springs in the upper reaches of the basin that contribute highly saline water to the Wichita River base flow. The salt springs have been assigned area numbers (fig. 1) by the U.S. Army Corps of Engineers (USACOE). The USACOE is attempting to divert highly saline base flows from the basin in an effort to improve the water quality of the Wichita River (Keller and others, 1988).
The effectiveness of control structures (installed by the USACOE) at reducing high salinity loads to Lake Kemp downstream will be measured by the reduction in chloride and sulfate loads over time. The goal of the USACOE effort is to reduce salinity loads in the basin to the level that water from the Wichita River can be used as a potable municipal supply, resulting in an important new water-supply resource in this basin of limited good-quality water. This fact sheet presents water-quality and biological data collected at sampling sites in the Wichita River Basin during October 1, 1996–September 30, 1997, by the U.S. Geological Survey (USGS) in cooperation with the Red River Authority of Texas (RRA). Cooperation in this data-collection effort also was provided by the U.S. Army Corps of Engineers, Tulsa District; City of Wichita Falls; Wichita County Water Improvement District No. 2; and Texas Water Development Board.
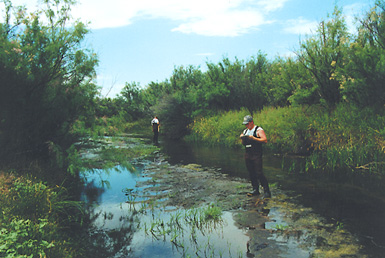
Several types of water-quality and biological data were collected in the Wichita River Basin as follows (table 1): selected standard physical properties and constituents were collected hourly at 12 sites (C), weekly at four sites (W), and monthly at one site (M); inorganic constituents were collected quarterly at nine sites (Q) and monthly at nine sites (M); trace elements were collected monthly at nine sites (M); rapid bioassessment (RBA) surveys (photograph A) were done yearly for fish at eight sites (Y) and yearly for macroinvertebrates at five sites (Y); dissolved oxygen (continuous readings for a 24-hour period) was measured yearly at three sites to assess algal productivity (Y); and bacteriological constituents (fecal coliform and Escherichia coliform) were collected nine times per year at nine sites (9/YR).
|
| A. Rapid bioassessment survey. |
Hourly collection of temperature and specific-conductance data and discrete sampling of specific ions such as chloride and sulfate, combined with hourly discharge readings, allow computation of chloride and sulfate loads (table 2). Specific conductance is highly correlated (coefficient of determination (R2) greater than 0.95) with dissolved chloride and sulfate concentrations; thus regression equations to compute these loads can be developed for each site. Because regression equations were computed only if at least 24 trace-element data points (24 months) were available, no equations were computed for the Wichita River near Seymour, at State Highway 25, at Loop 11, or at Charlie (sites 15, 17, 19, 20), or for Beaver Creek near Electra (site 18) The largest weighted average specific conductance (32,190 microsiemens per centimeter at 25 degrees Celsius (µS/cm)), dissolved chloride (10,600 mg/L), and dissolved sulfate (2,800 mg/L) were measured at South Wichita River at low flow dam near Guthrie (site 11), where highly saline flows are diverted from the river and pumped to Truscott Brine Lake (fig. 1). The highly saline low flows are trapped at this site (photograph B) by an inflatable dam. The dam is lowered during high flows, which are characterized by smaller dissolved chloride and sulfate concentrations. The goal is to decrease the salinity of inflows to Lake Kemp, thus providing residents of the Wichita River Basin another source of usable water. Wichita River near Seymour (site 15), just upstream from Lake Kemp, has much smaller weighted average specific conductance (9,600 µS/cm), dissolved chloride (2,880 mg/L), and dissolved sulfate (1,710 mg/L). A similar dam structure is in place at the Middle Fork Wichita River near Guthrie (site 9); however, the pipeline to the disposal site, Truscott Brine Lake, has not been constructed.
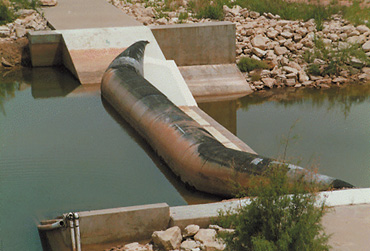 |
| B. Water-control structure in Area VIII. |
Samples for trace-element concentrations were collected using parts-per-billion protocols developed by the USGS National Water-Quality Assessment program. Nine sites were sampled monthly, except for the South Wichita River at Ross Ranch near Benjamin (site 13), which went dry during the early fall of 1996 and the summer of 1997. Also, only 11 samples were analyzed at sites 8 and 12. Median concentrations of total arsenic, total cadmium, total chromium, total copper, total iron, total lead, and total selenium (table 3) were less than levels recommended for drinking water by the U.S. Environmental Protection Agency (1996). The selenium freshwater chronic criteria for aquatic life is 5 micrograms per liter (µg/L) (Texas Natural Resource Conservation Commission, 1997). Concerns had been raised that removal of water with large chloride concentrations could cause elevated concentrations of selenium in the Red River Basin (specifically near Lake Texoma) that could affect water fowl in the basin (Ronda S. Johnson, Red River Authority of Texas, oral commun., 2000). The distribution of selenium concentrations at the nine sites is shown in figure 2.
Assessments for fish, macroinvertebrates, algal productivity, and bacteria give valuable insight into the biological health of streams in the Wichita River Basin. Little information exists on the biological communities of this geographical region, which hinders long-term comparisons between biological assessments. The RBA, a major tool for biological assessment of fish and macroinvertebrates, was used to quantify biological indices at eight sites (table 1). Dissolved oxygen concentrations were used to determine algal productivity. The number of bacteria colonies present were used for the bacteria assessment.
Fish samples collected in an RBA survey (photograph C) during July 1997 were used to compute biological indices and provide a baseline for future reference. Fish species were identified and assigned origin groups, tolerance limits, and trophic levels (Hubbs and others, 1991; Plafkin and others, 1989). The RBA score (table 4) is based on 11 different characteristics of the fish population at a site. These characteristics (also known as metrics) are modified from an RBA method developed for fish in the subhumid agricultural plains of Texas (Gordon Linam, Texas Parks and Wildlife Department, personal commun., 1998). Each sampling site is classified as limited (less than 35), intermediate (35 to 40), high (41 to 48), or exceptional (greater than 48). A habitat survey (table 4) also was done for each site where an RBA survey for fish was completed. The habitat survey involves inventorying the vegetation and physical features at a site and computing a habitat score. Habitat scores are divided into four categories—poor (0 to 51), marginal (52 to 99), sub-optimal (100 to 147), and optimal (148 to 180).
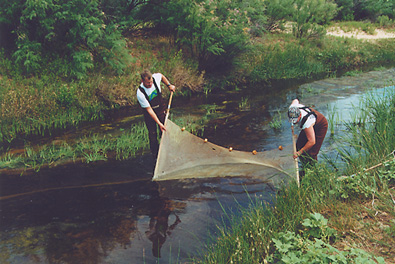 |
| C. Seining for fish. |
Four sites had RBA scores of limited (table 4). The mainstem Wichita River had RBA scores of limited for two sites (5, 17), intermediate for one site (20), and exceptional for one site (16). The lower scores could be attributed to poor water quality (for example, large dissolved solids concentrations) or to poor habitat conditions (for example, low vegetation density). The habitat-survey scores were sub-optimal for two sites (3, 16) and marginal for the remaining sites (table 4). The RBA scores combined with the habitat-survey scores are important in differentiating between low RBA scores indicating poor water quality and those scores indicating poor habitat. For example, the two sites (3, 16) with the highest RBA scores also had the highest habitat-survey scores, and the two sites (5, 7) with the lowest RBA scores had the third lowest and lowest habitat-survey scores, an indication that fish viability could be affected by habitat quality at these sites. A more in-depth technical report for RBAs in the Wichita River Basin is available from the RRA (Alan Plummer Associates, Inc., 1997).
An RBA of macroinvertebrates (photograph D), invertebrates large enough to
be seen with the naked eye (for example, most aquatic insects, snails, and amphipods),
was done during September 27–October 4, 1996. The macroinvertebrate RBA
was done at
five sites (5, 6, 7, 17, 20) in the Wichita River Basin where an RBA for fish
and a habitat survey also had been done. The goal was to identify the macroinvertebrate
taxa present in the basin, thus providing data for future trend analysis of
habitat conditions.
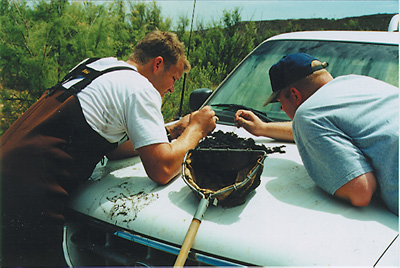 |
| D. Identification of macroinvertebrates. |
The macroinvertebrate RBA was modified (using many of the same components) from rapid bioassessment protocol II (Barbour and others, 1992; Plafkin and others, 1989), which used seven population characteristics to quantify the biological health of streams sampled for macroinvertebrates. These biological integrity index scores integrate water-quality conditions over a period of time (as compared to taking a grab sample for water-quality analysis). In addition, trends in biological health can be determined if RBAs are performed periodically.
The biological integrity index score indicated moderate impairment at sites 5, 6, and 7 and non-impairment at sites 17 and 20. These five sites also had the lowest habitat-survey scores (table 4), most likely attributed to the combination of poor water-quality conditions and the lack of suitable habitat for colonization. Overall, biological integrity appeared to be most affected by habitat availability and suitability, although water quality (for example, large dissolved solids concentrations and turbidity) also plays a major role in the biological integrity of the sampling sites throughout the basin.
The Red River Authority of Texas (1997) annual assessment report indicated concern for elevated nitrogen and phosphorus concentrations in this segment of the Wichita River. In a normal aquatic environment, light, nitrogen, and (or) phosphorus are the primary factors in algal productivity. If nitrogen and (or) phosphorus concentrations increase because of man-made inputs or natural processes, algal productivity can increase and, in turn, can lead to negative effects on a water body (for example, wide variation in diurnal dissolved oxygen). If insufficient light is present because of physical constraints (large sediment concentrations), algal productivity will decline.
An algal-productivity assessment used dissolved oxygen data to determine if nutrients were causing excessive algal growth. The assessment was done at three sites (5, 17, 20) during August 14–September 19, 1996. Dissolved oxygen was measured once in the morning and once in the evening to provide insight to the quantity of algal production in relation to the amount of oxygen produced during daylight hours. Only site 17 showed widely varying results; on August 14, 1996, a clear sunny day, the dissolved oxygen increased from 6.08 mg/L in the morning to 10.3 mg/L in the evening. The other two sites showed minimal diurnal variation in rates of oxygen production, indicating a low level of photosynthetic activity. The limited light penetration in water within this basin could act as the limiting factor for algal productivity instead of nitrogen or phosphorus. Thus, increased nutrient concentrations might not greatly affect algal productivity.
Fecal coliform and Escherichia coliform densities were determined three times per month for three consecutive months (August, September, and October 1996) at nine sampling sites (table 5). The Texas surface water quality standard (TSWQS) for fecal coliform is 200 colonies per 100 milliliters (cols./100 mL) (Texas Natural Resource Conservation Commission, 1995). The geometric mean of five samples within a month should not exceed this standard of 200 cols./100 mL. There is no state (Texas) standard for Escherichia coliform densities. Although the sampling protocol does not suffice for indicating violations, it can help determine whether more bacteriological analyses are needed for a particular sampling site.
The results show that 13 of 81 (about 16 percent) samples collected exceeded the TSWQS standard of 200 cols./100 mL. The week of September 2–6 accounted for eight of the 13 exceedances because of the excessive rainfall during this particular week, which led to surface runoff from land with bacteriological sources (agricultural and urban activities). These exceedances would be expected during similar conditions and are not indicative of a major problem in the Wichita River Basin because the bacteria densities quickly return to normal ranges after the rainfall. The maximum fecal coliform density was 2,400 cols./100 mL at site 20, and the maximum Escherichia coliform density was 90 cols./100 mL at sites 1 and 2.
Baldys, Stanley, III, and Phillips, D.G., 1997, Stream monitoring and educational program in the Red River Basin, Texas 1996–97: U.S. Geological Survey Fact Sheet FS–170–97, 6 p.
Barbour, M.T., Plafkin, J.L., Bradley, B.P., Graves, C.G., and Wisseman, R.W., 1992, Evaluation of EPA’s rapid bioassessment benthic metrics—Metric redundancy and variability among reference stream sites: Environmental Toxicology and Chemistry, v. 11, no. 4, p. 437–449.
Hubbs, C.L., Edwards, R.J., and Garrett, G.P., 1991, An annotated checklist of the freshwater fishes of Texas, with keys to identification of species: Texas Journal of Science, v. 43, no. 4, 56 p.
Keller, Jack, Rawson, Jack, Grubb, Hubert, Kramer, Jackson, and Sullivan, Glenn, 1988, Report on the evaluation of the effectiveness of operation of area VIII Red River Chloride Control Project: Red River Chloride Control Project Report, 35 p.
Plafkin, J.L., Barbour, M.T., Porter, K.D., Gross, S.K., and Hughes, R.M., 1989, Rapid bioassessment protocols for use in streams and rivers—Benthic macroinvertebrates and fish: U.S. Environmental Protection Agency, Office of Water, EPA/444/4–89–001.
Alan Plummer Associates, Inc., 1997, Wichita River Basin chloride monitoring data review: Fort Worth, 27 p.
Ramos, M.G., ed., 1997, Texas almanac, 1998–1999: The Dallas Morning News, 672 p.
Red River Authority of Texas, 1997, Assessment of the biological habitat quality of the Wichita River Basin in Texas using macroinvertebrates: Wichita Falls, 412 p.
Texas Natural Resource Conservation Commission, 1995, Texas surface water quality standards: Texas Natural Resource Conservation Commission [variously paged].
______1997, Texas surface water quality standards: Texas Administrative Code, Title 30, Environmental Quality, part 1, chap. 307, 125 p.
U.S. Environmental Protection Agency, 1996, Drinking water regulations and
health advisories: U.S. Environmental Protection Agency
EPA–822–B–96–002, p. 16.