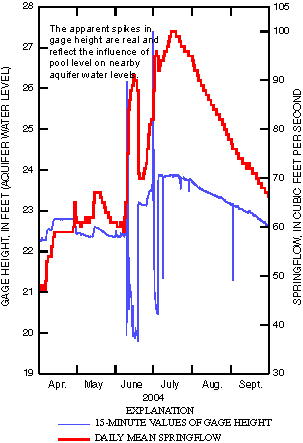
Figure 3. Comparison of gage height and computed and estimated daily mean springflow for 08155500 Barton Springs at Austin, Texas, April 1–September 30, 2004.
Back to Contents | Back to Text | Figure 4