 |
|
|
||||
| Fact Sheet 2006-3124 |
By Roslyn Ryan
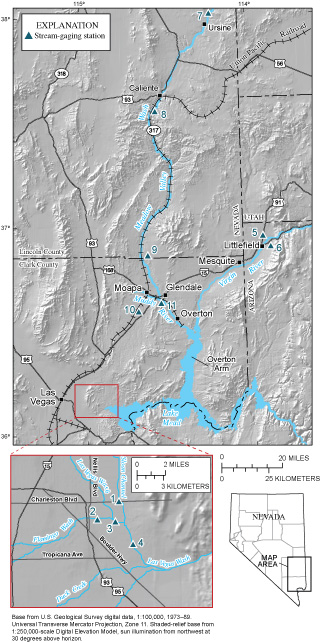
Figure 1. Geographic and hydrologic features, including Las Vegas Valley, and location of streamflow-gaging stations where peak discharges were measured in Clark and Lincoln Counties, southeastern Nevada, December 2004 and January 2005.
A regional storm passed through the Las Vegas Valley, Nevada, on December 28–29, 2004, producing up to 2 inches of rain in a 24-hour period. Due to the intense, sustained rainfall, streamflow along Las Vegas Wash was near the record discharges of July 8, 1999. Additional rainfall in December and in January, combined with an early warming trend, resulted in record flooding along Meadow Valley Wash, Muddy River, and Virgin River, January 10–11, 2005 (figs. 1 and 2). On January 7, this warming trend resulted in about a 15ºF (degree Fahrenheit) increase over the previous week (fig. 2). This temperature spike, along with further precipitation, caused much of the snow pack in the surrounding mountain ranges to melt and run off into the valleys. These two factors led to the major flood events in Clark and Lincoln Counties during December 2004 and January 2005. Total flood and storm damage for Lincoln County was estimated at $9.4 million and $4.5 million for Clark County (Manning, 2005).
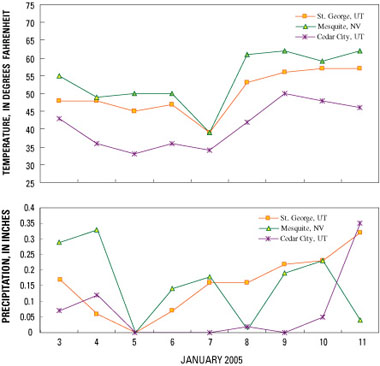
Figure 2. Temperature and precipitation data for areas
in the Meadow Valley Wash and Virgin River Basins,
January 3–11, 2005. See Pierce, 2005.
Clark County generally is drained by the Las Vegas and Meadow Valley Washes, and the Muddy and Virgin River systems. Las Vegas Valley is drained by Duck Creek, Tropicana Wash (not in fig. 1), Flamingo Wash, Las Vegas Wash, and several smaller tributaries (fig. 1). Water in these drainages generally flows eastward through Las Vegas to Las Vegas Wash and on toward Lake Mead, an impoundment of the Colorado River. The Virgin River originates in southern Utah, flows past Littlefield, AZ, through Mesquite, NV, and into the Overton Arm of Lake Mead. Meadow Valley Wash flows from Ursine, NV, through Caliente, NV, continues southeast through Moapa Valley, and into the Muddy River at Glendale, NV. The Muddy River flows southeast through Moapa Valley into the Overton Arm of Lake Mead (Kane and Wilson, 2000).
The U.S. Geological Survey, in cooperation with Federal, State, and local agencies, operates a network of surface-water discharge stations in Clark and Lincoln Counties. Data from these stations are crucial for water-supply planning; flood monitoring and warning; emergency response; dam and reservoir-system operation; establishing flood-insurance rates; and engineering and maintenance of bridges, roads, and other structures.
Most of these stations provide real-time data through satellite or radio telemetry. Data from these stations are used by the National Weather Service, the Clark County Regional Flood Control District, and other agencies to manage water supplies, forecast floods, and issue flood warnings.
U.S. Geological Survey field crews conducted hydraulic surveys after the December 2004 and January 2005 floods to determine peak discharge at stations where discharge measurements were unobtainable during the high flows. The discharge data contribute to understanding flood behavior, enhance efforts to minimize destruction caused by floods, and provide understanding for resource planning.
Information on peak discharges for selected stations in Clark and Lincoln Counties are listed in table 1. The table includes site number (see fig. 1), station number, station name, December 2004 and January 2005 peak discharges, period of record, and the date of the largest historical peak discharge recorded prior to December 2004.
Table 1. Peak discharges at selected sites in Clark and Lincoln Counties, Nevada.
[Peak-discharge data are reported to differing accuracies depending on method of computation
(example: instantaneous-
discharge measurement or indirect computation) and on assessed data
quality. Data were compiled from Bostic and
others (1997), Berris and others (2003), and Stockton
and others (2004), and from unpublished data on file at
U.S. Geological Survey offices in Henderson, NV]
|
Site number |
Streamflow-gaging station |
Peak |
Period |
Largest historical peak discharge recorded, period of record prior to December 29, 2004 |
||
|---|---|---|---|---|---|---|
|
Station number |
Station name |
Date |
Peak |
|||
|
Sites in Las Vegas Valley- December 29, 2004 |
||||||
|
1 |
09419665 |
Sloan Channel at Charleston Boulevard near Las Vegas, NV |
1,000 |
1989-2005 |
09/09/02 |
1,860 |
|
2 |
094196781 |
Flamingo Wash at Nellis Boulevard near Las Vegas, NV |
2,400 |
a1969-87, |
07/08/99 |
5,600 |
|
3 |
094196783 |
Las Vegas Wash below Flamingo Wash confluence near Las Vegas, NV |
10,600 |
1984, 1987, |
07/08/99 |
11,000 |
|
4 |
094196784 |
Las Vegas Wash at Vegas Valley Drive near Las Vegas, NV |
11,700 |
1984, |
07/08/99 |
11,000 |
|
Sites outside Las Vegas Valley-January 10-11, 2005 |
||||||
|
5 |
09414900 |
Beaver Dam Wash at Beaver Dam, AZ |
15,000 |
1993-2005 |
02/10/93 |
5,940 |
|
6 |
09415000 |
Virgin River at Littlefield, AZ |
37,000 |
1930-2005 |
12/06/66 |
b35,200 |
|
7 |
09417500 |
Meadow Valley Wash at Eagle Canyon near Ursine, NV |
950 |
1963-74, |
01/25/69 |
c700 |
|
8 |
09418500 |
Meadow Valley Wash near Caliente, NV |
8,000 |
1951-60, |
03/05/78 |
c2,400 |
|
9 |
09418700 |
Meadow Valley Wash near Rox, NV |
7,500 |
1988-94, |
02/10/93 |
1,620 |
|
10 |
09417300 |
California Wash near Moapa, NV |
800 |
1981, |
08/10/81 |
30,600 |
|
11 |
09419000 |
Muddy River near Glendale, NV |
8,600 |
1950-2005 |
08/10/81 |
16,400 |
|
a Equivalent station operated at Flamingo Wash near mouth at Las Vegas, NV (station 09419678), 1969-87 (Frisbie and others, 1985). b Highest peak with exception of 61,000 cubic feet per second on January 1, 1989, due to failure of Quail Creek Dam. c Discharge is affected by regulation or diversion. |
||||||
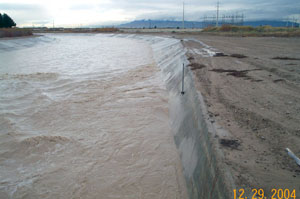
Figure 3. View downstream of flow recession in Las Vegas Wash at Vegas Valley Drive (site 4), December 29, 2004. See figure 1 for site location.
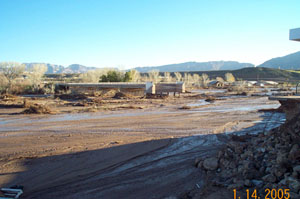
Figure 4. View of flood damage along Beaver Dam Wash at Beaver Dam,
AZ, January 14, 2005.
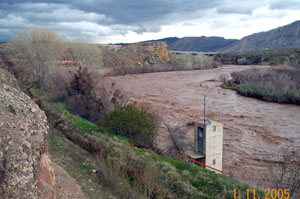
Figure 5. View upstream of flow near the peak discharge (37,000 ft³/s)
in the Virgin River at Littlefield, AZ, January 11, 2005.
On December 28, 2004, a valleywide storm passed through the Las Vegas Valley producing up to 2 inches of rain in a 24-hour period. Runoff from this storm flowed into most of the main drainage basins in the Las Vegas Valley. The peak discharge along the Flamingo Wash was 2,400 ft³/s (cubic feet per second) at Nellis Blvd. (site 2; fig. 1, table 1). The combined peak discharge for the Las Vegas and Flamingo Washes totaled 10,600 ft³/s (site 3). Just downstream of the Flamingo Wash confluence, Sloan Channel flows into Las Vegas Wash where discharge was measured at 1,000 ft³/s. The combined discharge from the Las Vegas Wash and Sloan Channel was 11,700 ft³/s at Las Vegas Wash at Vegas Valley Drive (site 4; figs. 1 and 3), a new peak of record.
The flooding along the Virgin River, Meadow Valley Wash, and Muddy River was caused by an early warming trend the second week of January 2005. The winter storms from late December produced precipitation and snowfall in the surrounding mountain ranges. Starting on January 7, 2005, temperatures raised about 15ºF above temperatures of the previous weeks (fig. 2). This temperature rise, along with additional rain, caused rapid snowmelt resulting in record flooding along the Virgin River and Beaver Dam Wash (sites 5 and 6; fig. 1).
Portions of Mesquite, Overton, Beaver Dam, and Caliente were impacted by these floodwaters. Over 75 homes in Mesquite had to be evacuated, and about 350 homes in Overton were damaged by the floodwaters. In Beaver Dam, AZ, more than 20 homes were destroyed along with a large portion of the main bridge on U.S. Highway 91 (site 5; figs. 1 and 4). In Caliente, NV,
about 60 homes, portions of State Route 317, and the Union Pacific Railroad tracks were destroyed by floodwaters (Pierce, 2005).
The flow at Beaver Dam Wash at Beaver Dam, AZ, reached a record peak discharge of 15,000 ft³/s (site 5; fig. 1, table 1). This flow from Beaver Dam Wash, combined with flow from the Virgin River upstream from the confluence of Beaver Dam Wash and the Virgin River, resulted in a computed peak discharge of 37,000 ft3/s at Virgin River near Littlefield, AZ (site 6; figs. 1 and 5).
The Meadow Valley Wash gages also had record peak discharges. The discharge at Meadow Valley Wash at Eagle Canyon near Ursine (site 7; fig. 1, table 1) was 950 ft³/s. The peak continued downstream gaining additional flow from tributaries increasing to 8,000 ft³/s at Meadow Valley Wash near Caliente (site 8) and 7,500 ft³/s near Rox (site 9). The flow from the Meadow Valley Wash, along with 800 ft³/s from the California Wash near Moapa (site 10), combined with the Muddy River near Glendale (site 11) to reach a peak discharge of 8,600 ft³/s.
Berris, S.N., Crompton, E.J., Joyner, J.D., and Ryan, Roslyn, 2003, Water resources data, Nevada, water year 2002: U.S. Geological Survey Water-Data Report NV-02-1, 600 p.
Available at URL: https://pubs.usgs.gov/wdr/wdr-nv-02-1.
Bostic, R.E., Kane, R.L., Kipfer, K.M., and Johnson, A.W., 1997: Water resources data, Nevada, water year 1996: U.S. Geological Survey Water-Data Report NV-96-1, 611 p.
Frisbie, H.R., La Camera, R.J., Riek, M.M., and Wood, D.B., 1985, Water resources data, Nevada, water year 1984: U.S. Geological Survey Water-Data Report NV-84-1, 247 p.
Kane, R.L., and Wilson, J.W., 2000, Floods of July and September 1998 in Clark County, Nevada: U.S. Geological Survey Fact Sheet 079-00, 4 p.
Manning, Mary, 2005, Nevada eligible for FEMA funds: Las Vegas Sun, March 9, 2005.
Pierce, Barry, 2005, River flooding impacts communities along the Virgin and Muddy Rivers: National Weather Service, Las Vegas, NV, The Desert Sun, SKYWARN Spotter Newsletter, Spring 2005.
Stockton, E.L., Jones, C.Z., Rowland, R.C., and Medina, R.L., 2004, Water resources data, Nevada, water year 2003: U.S. Geological Survey Water-Data Report NV-03-1, 679 p. Available at URL: https://pubs.usgs.gov/wdr/wdr-nv-03-1.
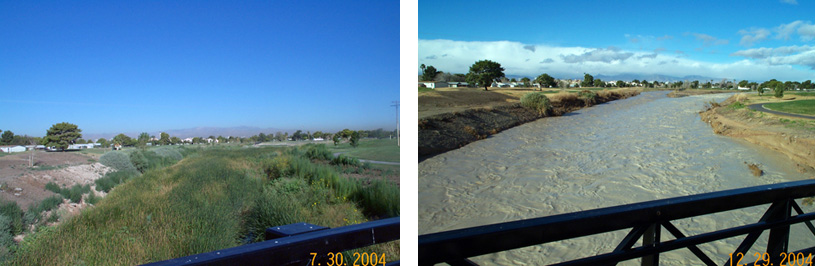
Las Vegas Wash looking upstream, July 30, 2004, and December 29, 2004.
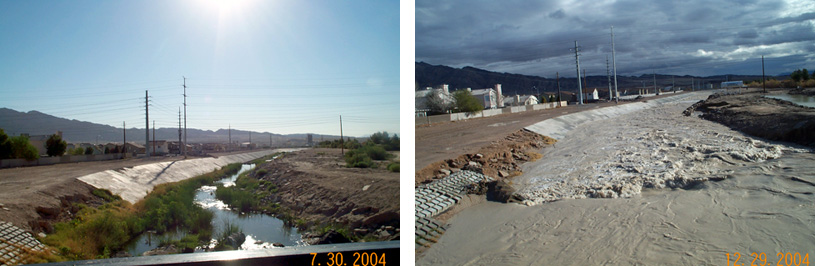
Las Vegas Wash looking downstream, July 30, 2004, and December 29, 2004.
For further information about this study, contact
Public Information Assistant
USGS Nevada Water Science Center
2730 North Deer Run Road
Carson City, NV 89701
Telephone: 775-887-7649
Fax: 775-887-7629
Email: GS-W-NV Public Information@usgs.gov
For more information about USGS activities in Nevada, visit the USGS Nevada Water Science Center home page.

![]() U.S. Department of the Interior | U.S. Geological Survey
U.S. Department of the Interior | U.S. Geological Survey
Persistent URL: https://pubs.water.usgs.gov/fs20063124
Page Contact Information: USGS Publishing Network
Page Last Modified: Tuesday, 29-Nov-2016 17:23:48 EST