Fact Sheet 2009–3046
|
Fifty years of U.S. Geological Survey (USGS) research on glacier change shows recent dramatic shrinkage of glaciers in three climatic regions of the United States. These long periods of record provide clues to the climate shifts that may be driving glacier change. The USGS Benchmark Glacier Program began in 1957 as a result of research efforts during the International Geophysical Year (Meier and others, 1971). Annual data collection occurs at three glaciers that represent three climatic regions in the United States: South Cascade Glacier in the Cascade Mountains of Washington State; Wolverine Glacier on the Kenai Peninsula near Anchorage, Alaska; and Gulkana Glacier in the interior of Alaska (fig. 1). 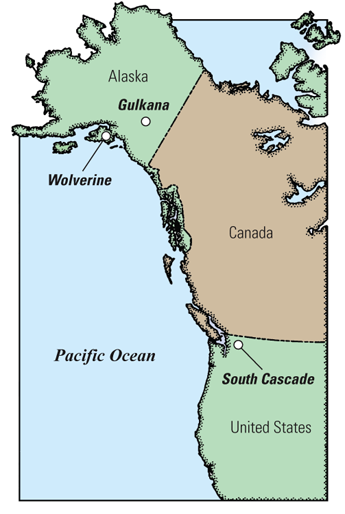
Figure 1. The Benchmark Glaciers. Glaciers respond to climate changes by thickening and advancing down-valley towards warmer lower altitudes or by thinning and retreating up-valley to higher altitudes. Glaciers average changes in climate over space and time and provide a picture of climate trends in remote mountainous regions. A qualitative method for observing these changes is through repeat photography—taking photographs from the same position through time (fig. 2). The most direct way to quantitatively observe changes in a glacier is to measure its mass balance: the difference between the amount of snowfall, or accumulation, on the glacier, and the amount of snow and ice that melts and runs off or is lost as icebergs or water vapor, collectively termed ablation (fig. 3). Positive mass balance occurs when accumulation is greater than ablation and if maintained over long periods results in glacier growth. Conversely, sustained periods of negative mass balance, where accumulation is less than ablation, results in glacier shrinkage. A shrinking glacier thins faster near the terminus (the lowest part of the glacier) than near the head (the highest part of the glacier), which is why the terminus retreats up-valley while the glacier head remains in place (fig. 2). The net balance is the average mass balance over the entire glacier for one glaciological year, the time between the end of the summer ablation season from one year to the next. 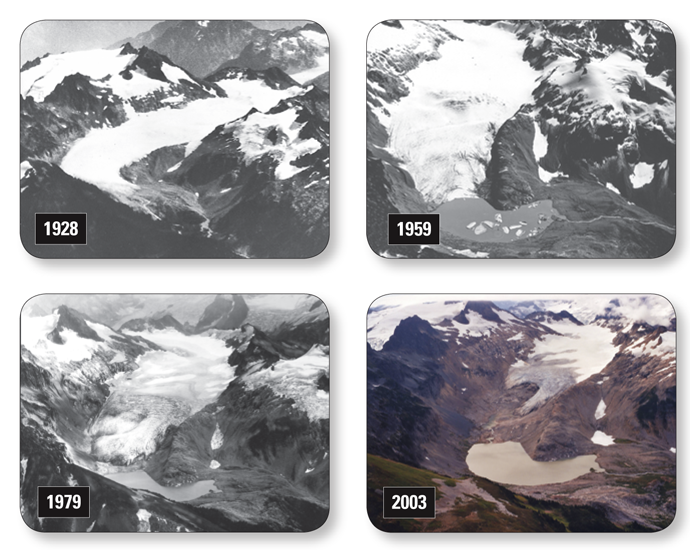
Figure 2. Retreat of South Cascade Glacier, Washington, during the 20th Century and the beginning of the 21st Century. 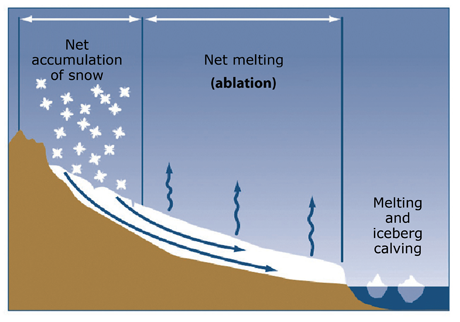
Figure 3. Diagram of a glacier showing components of mass balance. The USGS measures accumulation and ablation using a network of stakes distributed over the glacier (fig. 4). USGS scientists visit each site in spring and autumn (sometimes more often) to keep a running tally of accumulation and ablation for each stake. These stake measurements, along with local temperature and precipitation data, allow USGS scientists to estimate the glacier net balance, as well as the seasonal winter (total accumulation) and summer (total ablation) balances that sum to the net balance. 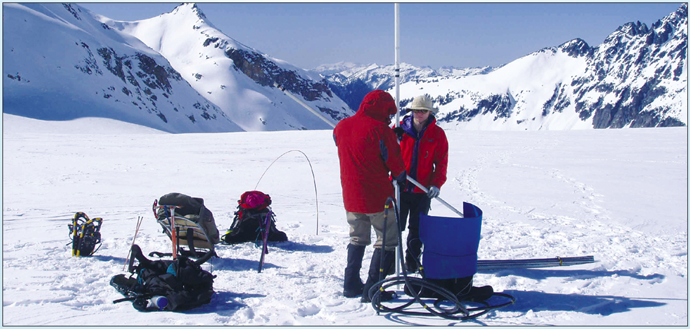
Figure 4. Setting a measurement stake at South Cascade Glacier, Washington. Regional climate exhibits strong control on glacier mass balance, and over decadal time scales mass balances correlate with regional climate change. Glaciers in coastal, maritime locations (such as Wolverine Glacier) exist primarily because of high snowfall rates, despite warm low-elevation temperatures. Glaciers in continental or interior climates (for example, Gulkana Glacier) exist primarily because cold temperatures result in low ablation. During climate changes, coastal glaciers are more sensitive to changes in precipitation (or the storm tracks that bring precipitation), whereas interior glaciers are more sensitive to changes in temperature. The 50-year mass balance records for these three USGS Benchmark Glaciers show annual and interannual fluctuations that reflect the controlling climatic conditions. Mass-balance data are presented here in three ways to show different aspects of the response of glaciers to climate: (1) cumulative net balance, (2) seasonal mass balance, and (3) mass turnover. Cumulative Net BalanceThe cumulative net balance is the total loss or gain of glacier mass since the beginning of the study period and is presented as spatially averaged thickness change (fig. 5). South Cascade Glacier lost mass at an almost constant rate during the late 1950s to the late 1960s, then gained mass until 1976, and has been losing mass at a fairly constant and rapid rate since 1977. At the same time that South Cascade Glacier was gaining mass in the early 1970s, Wolverine Glacier was losing mass. The roles reversed in 1977, as South Cascade Glacier began to lose mass once again while Wolverine Glacier began to gain mass and continued to do so until 1989. The opposite trends for these two maritime glaciers were the result of a shift in the winter storm tracks coming from the northeast Pacific Ocean. This shift most likely was due to a shift in the phase of the Pacific Decadal Oscillation (PDO), which is an ocean-climate oscillation (similar to the El Niño Southern Oscillation) in which the pattern of ocean surface temperatures and atmospheric pressures in the North Pacific Ocean oscillates on about a multi-decadal timescale. In its warm phase, the PDO tends to be associated with more northerly storm tracks, which in the past provided moisture for the growth of Wolverine Glacier at the expense of South Cascade Glacier. The PDO cold phase tends to be associated with more southerly storm tracks directed at the Washington coast; South Cascade Glacier has tended to gain mass from this moisture at the expense of Wolverine Glacier. Gulkana Glacier is inland and relatively isolated from maritime influences; therefore, the glacier has not responded distinctively to shifts in the PDO and to positions of winter storm tracks. 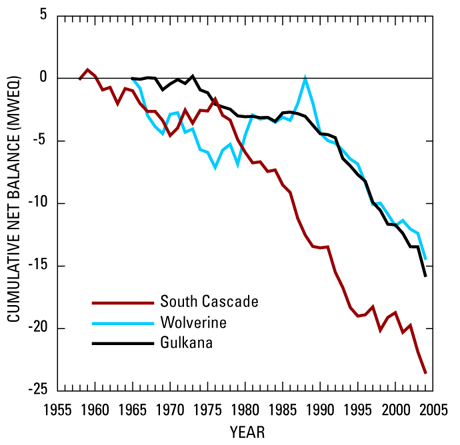
Figure 5. Cumulative net balance of South Cascade, Wolverine, and Gulkana Glaciers (Josberger and others, 2007). Densities of snow and ice differ considerably and before glacier-average thickness changes in each material can be summed to the net balance, the changes must be converted to a common basis. By custom, the common basis is "meters water equivalent" (MWEQ), which is the thickness of water that would result from melting a given thickness of snow or ice. Since 1989, the cumulative net balances of all three glaciers show trends of rapid and sustained mass loss. This synchronous decline could be the result of recent climate changes that are stronger than the PDO-induced variations of the earlier periods of record. Seasonal Mass BalanceThe cumulative net mass balance describes long-term trends in the glacier shape and size, that is, whether the glacier is growing or shrinking. On the other hand, seasonal balances (fig. 6) can reveal whether variations in temperature or precipitation are primary factors for observed changes. For example, several years of unusually high snowfall during the late 1970s and early 1980s caused the subsequent growth of Wolverine Glacier. Figure 6 shows the strong influence of regional climate. The net balance of Wolverine Glacier (yellow bars) tracks the winter balance (blue bars) more closely than the summer balance (red bars), in accordance with its location in a coastal climate. Conversely, the net balance of Gulkana Glacier is best correlated with summer balance as expected because of the drier, continental climate of interior Alaska. 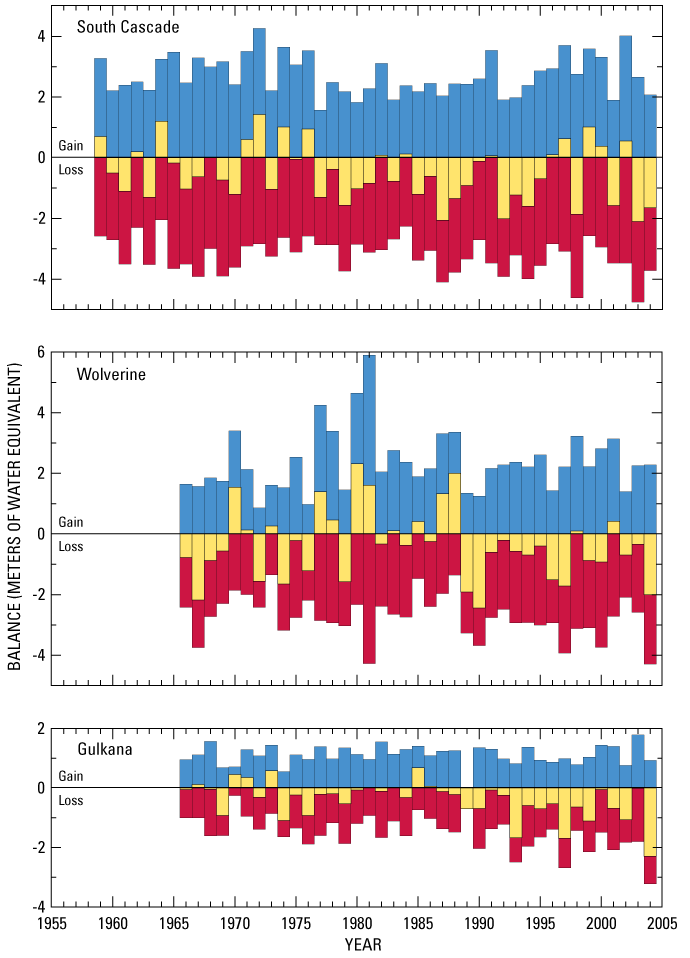
Figure 6. Time series of winter balance (net accumulation—blue), summer balance (net ablation—red), and net balance (yellow) for the three benchmark glaciers (Josberger and others, 2007). For all three glaciers, the summer balance records show that consistently more ablation took place during the period from 1987 to 2004 than did prior to 1987. This change, when coupled with a reduction in accumulation (thin snowpacks), has resulted in very negative net balances. This is exemplified by 2004, when strongly negative summer balances (fig. 6) resulting from record high temperatures and low precipitation, also set the stage for large, intense wildfires that burned in Alaska. Despite drought conditions, the warm weather caused excessive melting of glaciers in Alaska and consequent flooding of many glacier-fed rivers. One interpretation of the trend towards increasing summer melt at the Benchmark Glaciers is that climate changes that are larger in scale and intensity than periodic shifts in ocean conditions (PDO) are underway. Despite increasingly negative summer balances in the 1980s and 1990s, South Cascade Glacier did have a few years of positive mass balance; the most significant occurred in 1999, following the record 1998–99 winter snowfall. Snowy winters would have to occur much more frequently in the future to reduce or reverse mass loss from the glacier. Mass TurnoverA third way to explore the mass balance history of these three glaciers is by examining mass turnover, which describes the amount of water moving through the glacier system and the intensity of the local hydrologic cycle. Mass turnover is estimated by averaging the absolute values of winter and summer balances. Large mass turnover is typical of coastal, maritime glaciers where winter precipitation and snow accumulation are large. These glaciers can extend far down-valley to warm, low elevation regions (sometimes to sea level) where high ablation rates offset abundant maritime snow. In drier climates, such as the Rocky Mountains or interior Alaska, glaciers typically have relatively small mass turnover. With low total snowfall, glaciers in these areas melt before they extend far down valley. In accordance with these concepts, figure 7 shows that higher turnover rates occur at South Cascade and Wolverine Glaciers than at Gulkana Glacier. The USGS Benchmark Glaciers each exhibit a long-term trend of increasing mass turnover, which have become more well-defined and stronger from 1985 to 2005. Increased intensity of hydrologic cycling provides the simplest interpretation for the trend. 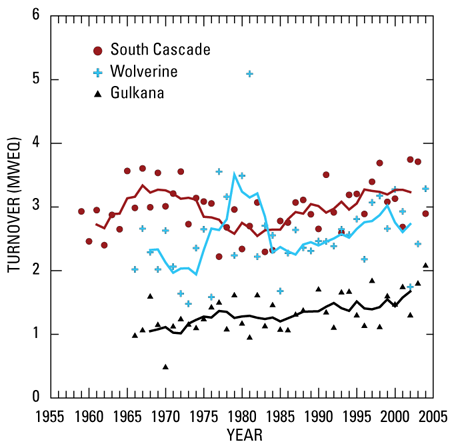
Figure 7. Mass turnover of the three benchmark glaciers. (5-year moving averages are plotted as lines). (Josberger and others, 2007). ConclusionsThe net mass balance of a glacier is the difference between the mass gain through accumulation of snow and the mass loss through ablation. A glacier that is in balance with the current climate will have zero net balance and a steady size. A glacier that is out of balance with the current climate will grow (advance) or shrink (retreat) depending on how the climate is changing (colder or wetter climate will cause advance, warmer or drier climate will cause retreat). The USGS has been monitoring the mass balance of three glaciers in the Pacific Northwest and in Alaska for nearly 50 years. This mass balance record is now sufficient to interpret glacier responses to short- and long-term climate changes in the Pacific Northwest, the Alaska Coast, and the Alaska interior. What have we learned so far?
The accelerating loss of mass, the weakening correlation with the PDO, and increasing mass turnover likely are the result of changes to warmer and (or) drier climate conditions that are affecting all three regions. The climate changes could be overwhelming the previously observed responses of the maritime glaciers to periodic shifts in ocean conditions, such as are represented by the PDO. References CitedJosberger, E.G., Bidlake, W.R., March, R.S., and Kennedy, B.W., 2007, Glacier mass-balance fluctuations in the Pacific Northwest and Alaska, USA: Annals of Glaciology, v. 46, p. 291-296. Meier, M.F., Tangborn, W.V., Mayo, L.R., and Post, A., 1971, Combined ice and water balances of Gulkana and Wolverine Glaciers, Alaska, and South Cascade Glacier, Washington, 1965 and 1966 Hydrologic Years: U.S. Geological Survey Professional Paper 715-A, 23 p., 4 pl. |
For more information contact: Edward Josberger, Research Oceanographer (ejosberg@usgs.gov) Rod March, Hydrologist (rsmarch@usgs.gov) Shad O’Neel, Glaciologist (soneel@usgs.gov) Website Part or all of this report is presented in Portable Document Format (PDF); the latest version of Adobe Reader or similar software is required to view it. Download the latest version of Adobe Reader, free of charge. |

![]() U.S. Department of the Interior |
U.S. Geological Survey
U.S. Department of the Interior |
U.S. Geological Survey
URL: http://
pubsdata.usgs.gov
/pubs/fs/2009/3046/index.html
Page Contact Information: GS Pubs Web Contact
Page Last Modified: Tuesday, 29-Nov-2016 17:33:37 EST
