
 |
 |
|
|
|
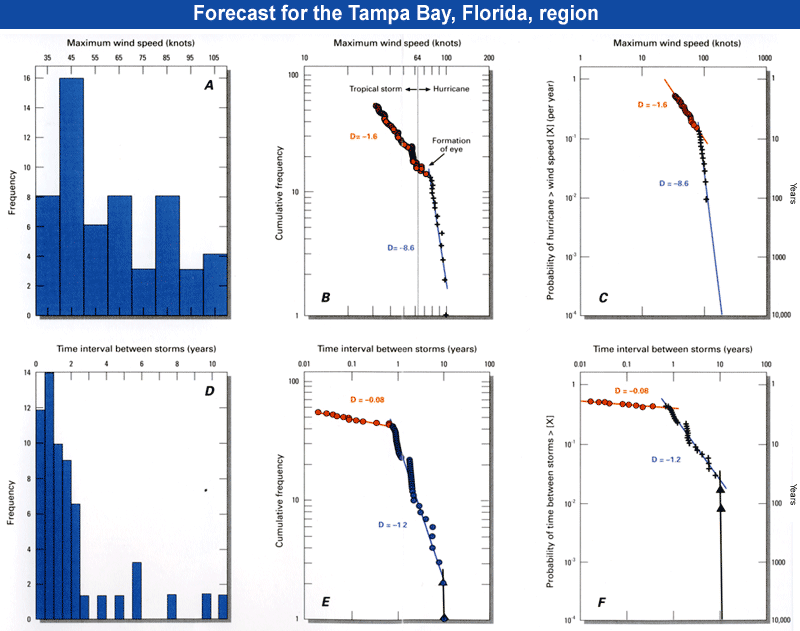
| 106 years of storm data for Tampa Bay region, Florida provides the basis for establishing scaling laws for wind speed and time intervals between storms. The insight provided by a log-log plot of data is shown (above) for maximum wind speed (on left) and for time intervals between storms (on right). Traditionally, data are plotted on a histogram plot (A and D). Structure in the data becomes apparent when data are replotted on logarithmic scales where two populations become clear (B) and scaling is revealed (E). Axes on the plot are converted to probability in (C and F) which permits extrapolation to forecast the probability of greater wind speeds and time intervals between storms. (Data from NOAA). |
 |