EDWARDS-TRINITY AQUIFER SYSTEM
INTRODUCTION
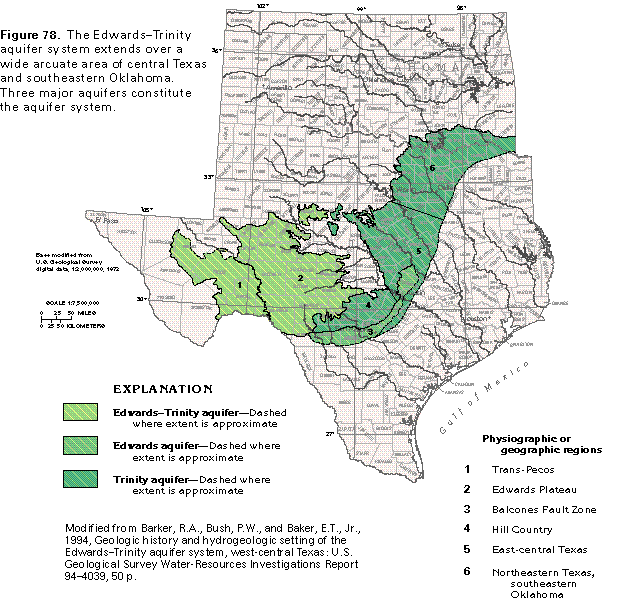
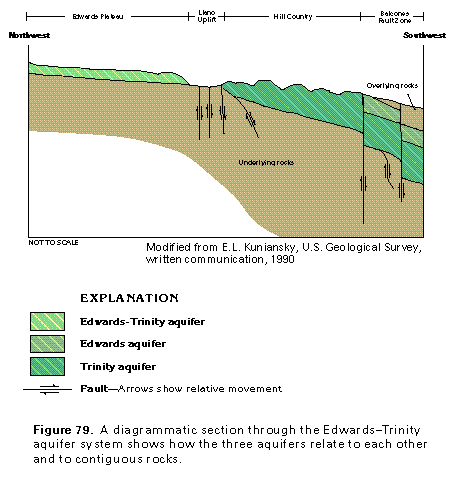
The Edwards-Trinity aquifer system is in carbonate and clastic rocks of Cretaceous age in a 77,000-square-mile area that extends from southeastern Oklahoma to western Texas (fig. 78). The aquifer system consists of three complexly interrelated aquifers-the Edwards-Trinity, the Edwards, and the Trinity aquifers (figs. 78 and 79). The Edwards-Trinity and the Trinity aquifers are stratigraphically equivalent in part and are hydraulically connected in some places. The Edwards aquifer overlies the Trinity aquifer (fig. 79) and the two aquifers are hydraulically connected where no confining unit separates them. The ground-water flow systems and permeability of the three aquifers are sufficiently different, however, to allow them to be separately mapped and described.
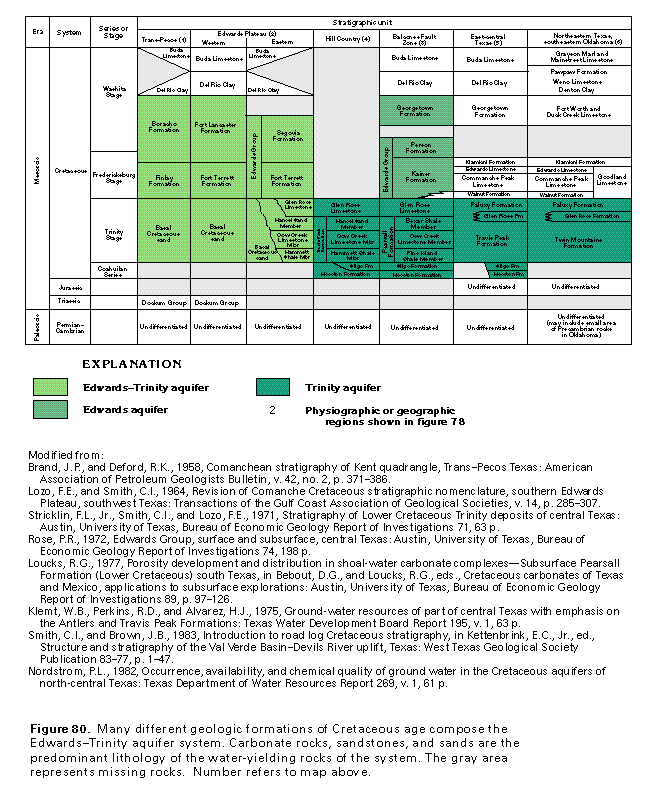
In the Trans-Pecos area (the area west of the Pecos River) and Edwards Plateau area of western and west-central Texas, the Edwards-Trinity aquifer consists of rocks of the Washita, the Fredericksburg, and the Trinity Stages, and the Coahuilan Series (fig. 80). In the Balcones Fault Zone area of south-central Texas, the rocks of the Washita and the Fred-ericksburg Stages are far more permeable than those of the overlying confining unit or the underlying Trinity aquifer and constitute the nearly separate flow system of the Edwards aquifer. Rocks of the Trinity Stage and the Coahuilan Series constitute the Trinity aquifer, which crops out on its updip edge from the Hill Country of south-central Texas into southeastern Oklahoma. In east-central Texas and into Oklahoma, rocks of the Washita and the Fredericksburg Stages that overlie the Trinity aquifer constitute a confining unit.
The rocks that compose the Edwards-Trinity aquifer are relatively flat-lying and are generally exposed at the land surface in the Trans-Pecos and the Edwards Plateau areas (fig.78). The geologic formations that compose the Trinity and the Edwards aquifers generally are exposed in updip areas, but they dip eastward and southward beneath younger units and lie deep in the subsurface. The downdip boundary of each aquifer approximately coincides with the farthest updip extent of water that contains 10,000 milligrams per liter dissolved solids.
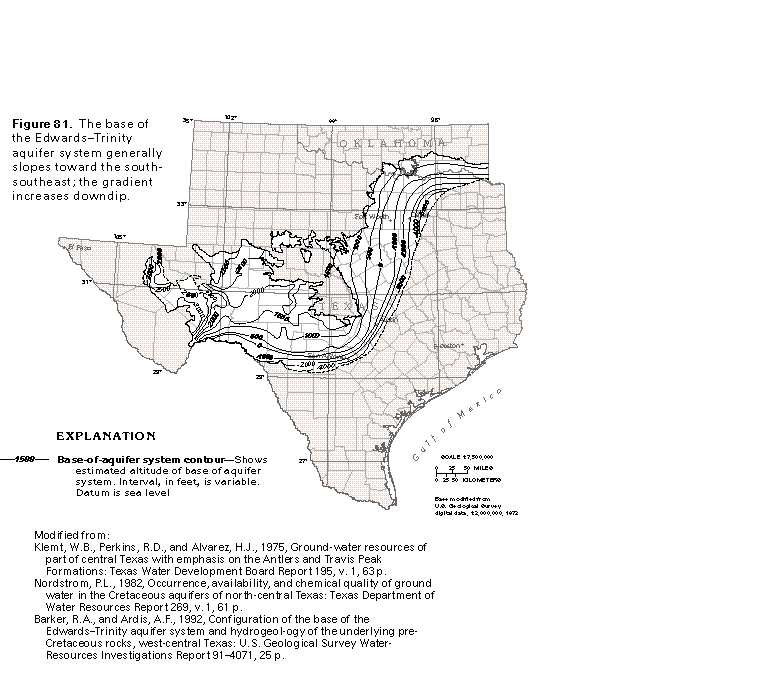
The base of the Edwards-Trinity aquifer system, which is an erosional unconformity developed on the surface of pre-Cretaceous rocks, is shown in figure 81. Generally, the base slopes toward the south-southeast; the gradient steepens in a downdip direction. The altitude of the base ranges from more than 5,000 feet below sea level in the northeast to more than 3,000 feet above sea level in the west.
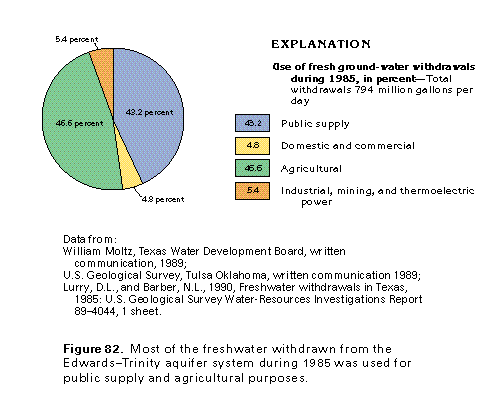
Withdrawals of freshwater from the Edwards-Trinity aquifer system totaled about 794 million gallons per day during 1985 (fig. 82). About 370 million gallons per day was withdrawn for agricultural purposes, slightly more than the 343 million gallons per day withdrawn for public supply. About 43 million gallons per day was pumped for industrial, mining, and thermoelectric-power uses, and the remaining 38 million gallons per day was withdrawn for domestic and commercial uses.
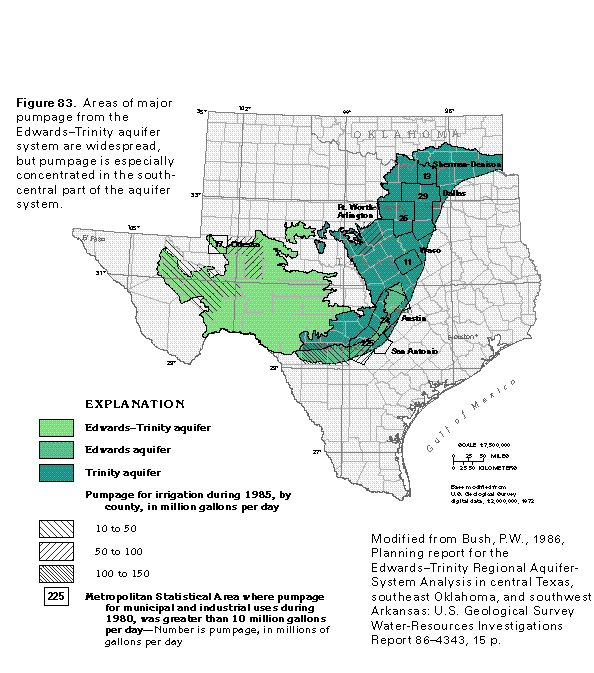
Areas with the largest rates of withdrawal are shown in figure 83. Withdrawals for municipal and industrial uses during 1980 exceeded 10 million gallons per day in the seven Metropolitan Statistical Areas shown in the figure, as defined by the Texas Department of Water Resources. These areas are Austin, Dallas, Fort Worth-Arlington, Odessa, San Antonio, Sherman-Denison, and Waco. Pumpage of 225 million gallons per day in the San Antonio area was far greater than that of the other Metropolitan Statistical Areas. Withdrawals for irrigation during 1985 exceeded 10 million gallons per day in 10 counties; pumpage was more than 100 million gallons per day in Uvalde County (fig. 83).
Edwards-Trinity Aquifer
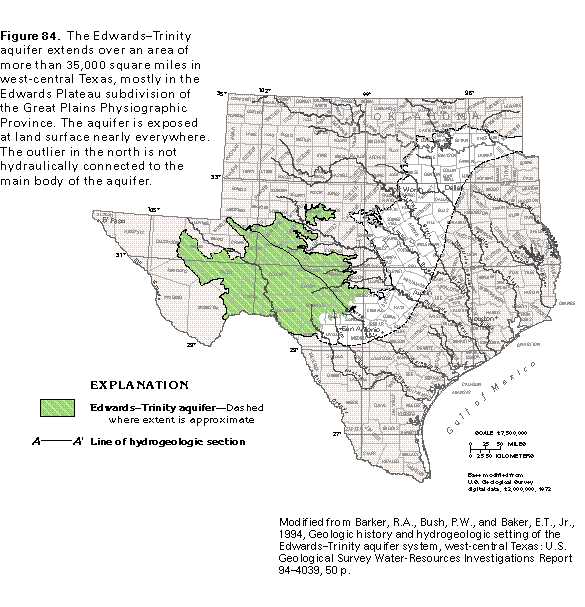
The Edwards-Trinity aquifer consists of rocks of Cretaceous age that are present in an area of about 35,500 square miles in west-central Texas (fig. 84). The aquifer is referred to in much of the literature as the "Edwards-Trinity (Plateau) aquifer." The area underlain by the aquifer is mostly on the Edwards Plateau, but it also extends into the Trans-Pecos area. The aquifer is located in the Great Plains Physiographic Province except for a small part that is in the Basin and Range Physiographic Province.
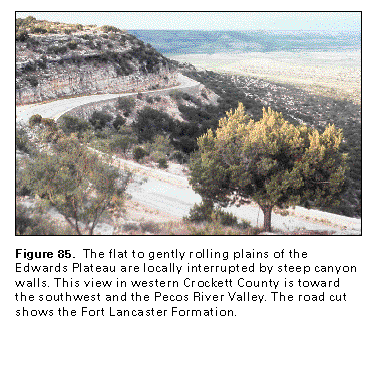
The topography of much of the area is characterized by flat to rolling, largely rocky plains that are dissected in places to form steep-walled canyons (fig. 85). The area is bounded on the west by mountain ranges. The altitude of the land surface ranges from about 1,000 feet at the Rio Grande in Val Verde County to more than 4,500 feet in the Davis Mountains in Jeff Davis County. Average annual precipitation ranges from about 12 inches in the west to about 30 inches in the east. Average annual runoff ranges from about 0.2 inch in the west to about 5 inches in the east. The Edwards-Trinity aquifer supplies large amounts of water for irrigation, particularly in the northwestern area; it also provides water to many small towns and cities.
HYDROGEOLOGY
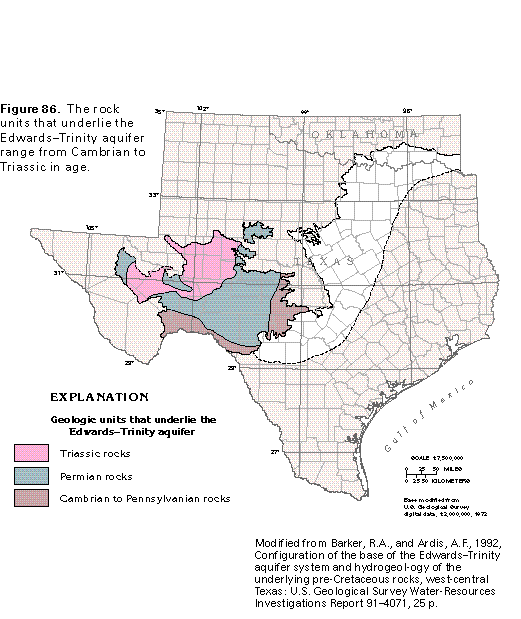
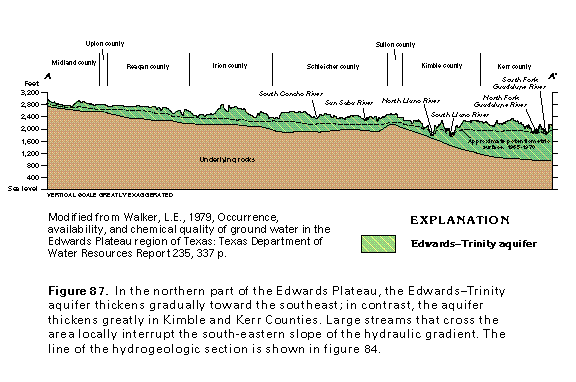
During Jurassic and very early Cretaceous time, the rocks in the area were subjected to erosion, and a flat to undulating plain was formed. This erosional surface, which underlies the Edwards-Trinity aquifer, was developed on rocks that range in age from Cambrian to Triassic (fig. 86). The early Cretaceous sea then advanced northward from the Gulf of Mexico across Texas. Deposition of clastic and carbonate rocks accompanied repeated advances and retreats of the ancient sea. The rocks that compose the Edwards-Trinity aquifer are generally limestone in the upper part and sand and sandstone in the lower part. The rocks dip and thicken to the southeast. Thickness of the aquifer ranges from a few tens of feet to more than 1,000 feet (fig. 87).
The complex nomenclature and lithologic character of the many geologic formations that compose the Edwards-Trinity aquifer are discussed in detail in several of the reports listed in the "References" section. The nomenclature is generalized for use in this Atlas (see fig. 80) and follows the local practice in which Early Cretaceous rocks are discussed in terms of provincial stratigraphic stages or series. The rocks of the Washita Stage and the Fredericksburg Stage consist generally of thin-bedded to massive limestone; the rocks of the Trinity Stage and the Coahuilan Series consist mostly of sand and sandstone, with some limestone and shale.
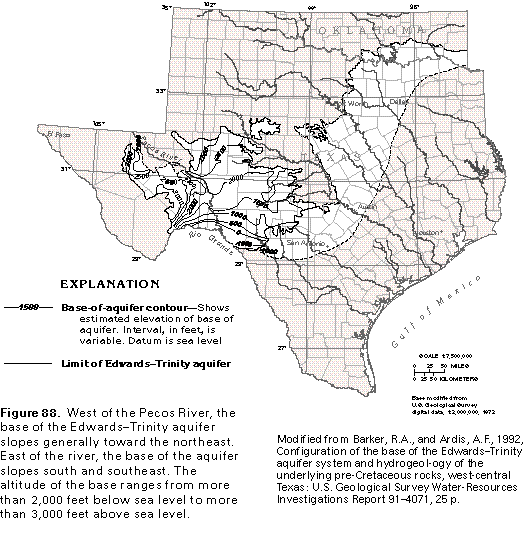
The base of the aquifer slopes generally to the south and southeast. The altitude of the base ranges from about 2,000 feet below sea level in the south to more than 3,000 feet above sea level in the west (fig. 88). Most of the rocks that underlie the Edwards-Trinity aquifer are much less permeable than those that compose the aquifer and, thus, serve as a barrier to ground-water flow. Locally, however, the underlying rocks are permeable and are hydraulically connected to the Edwards-Trinity aquifer, thus extending the thickness of the flow system.
The top of the aquifer is at land surface with the exception of areas capped with small, scattered remnants of Del Rio Clay or Buda Limestone and about 1,500 square miles in the northwest where the aquifer is covered by thick deposits of Pecos River alluvium.
The aquifer is generally recharged by direct precipitation on the land surface. Water is mostly unconfined in the shallow parts of the aquifer and is confined in the deeper zones.
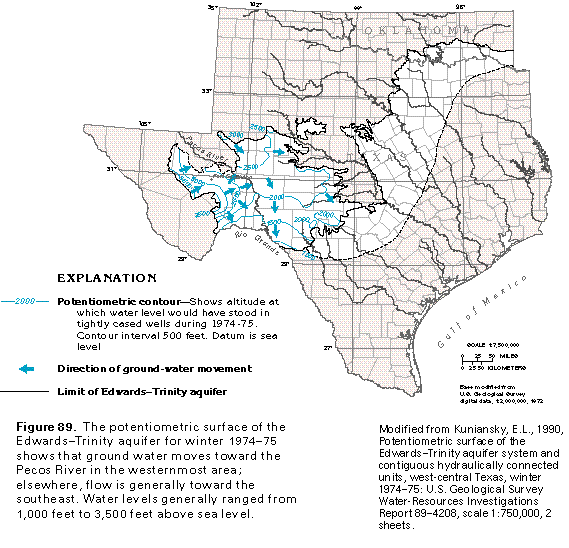
The altitude of the potentiometric surface of the Edwards-Trinity aquifer during the winter of 1974-75 ranged from about 1,000 feet to more than 3,500 feet above sea level (fig. 89). Ground water in the extreme west moves generally toward the Pecos River; elsewhere, the regional movement of water is toward the southeast. Much of the natural discharge from the aquifer is as spring flows along the southeastern edge of the Edwards Plateau where erosion has cut the rocks of the Edwards Group down to the water table. Springs that are present at the headwaters of many streams in these areas contribute substantially to stream base flow.
Depths of producing wells completed in the Edwards-Trinity aquifer typically range from 150 to 300 feet. Wells commonly yield from 50 to 200 gallons per minute. Well yields can vary greatly depending on the amount of development of secondary permeability in the limestone; yields from jointed and cavernous limestone can be as much as 3,000 gallons per minute. The water is generally a hard, calcium bicarbonate type and typically has concentrations of dissolved solids that range from 400 to 1,000 milligrams per liter.
GROUND-WATER DEVELOPMENT
Irrigation constitutes the most important use of water withdrawn from the Edwards-Trinity aquifer. Irrigation is concentrated in the northwestern part of the area where soil conditions are particularly favorable for farming. For much of the area, the lack of soil cover and the generally rocky terrain are the factors that limit the use of ground water for irrigation, rather than lack of water in the aquifer.
In the Trans-Pecos area, major irrigation areas are in southeastern Reeves County and northern Pecos County. In these areas, pumpage from the aquifer for irrigation in the 1960's and 1970's was about 89 million gallons per day. Ground-water levels declined nearly 150 feet from the late 1950's to the early 1970's in an irrigated area about 15 miles west-northwest of Fort Stockton. Withdrawals in this area were about 8 million gallons per day during 1974. Intense pumpage around Fort Stockton, particularly southwest of the city, has caused the cessation of flow from Comanche Springs at Fort Stockton. The springs once flowed at about 29 million gallons per day.
During 1972, withdrawal from the Edwards-Trinity aquifer for irrigation in the Edwards Plateau area was about 55 million gallons per day, or about 70 percent of the total water withdrawn in that area. Glasscock, Midland, and Reagan Counties are the principal users of irrigation water in the Edwards Plateau. Declining water levels and decreasing well yields have accompanied development. In southern Glasscock County, the ground-water level declined more than 100 feet from 1937 to 1966. In northern Reagan County, the water level declined 95 feet from 1954 to 1969 and another 50 feet from 1970 to 1987.
FRESH GROUND-WATER WITHDRAWALS
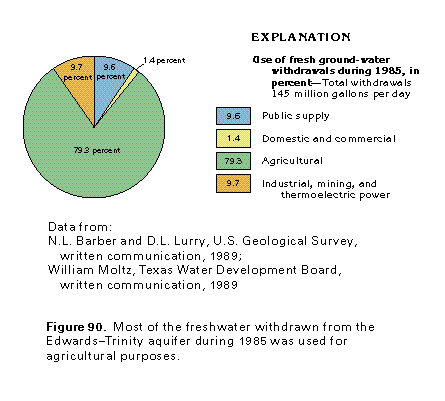
Withdrawals of freshwater from the Edwards-Trinity aquifer totaled about 145 million gallons per day during 1985 (fig. 90). About 115 million gallons per day was withdrawn for agricultural purposes, the principal water use. About 14 million gallons per day was withdrawn for each of two use categories: public supply and industrial, mining, and thermoelectric-power use. About 2 million gallons per day was withdrawn for domestic and commercial uses.
Edwards Aquifer
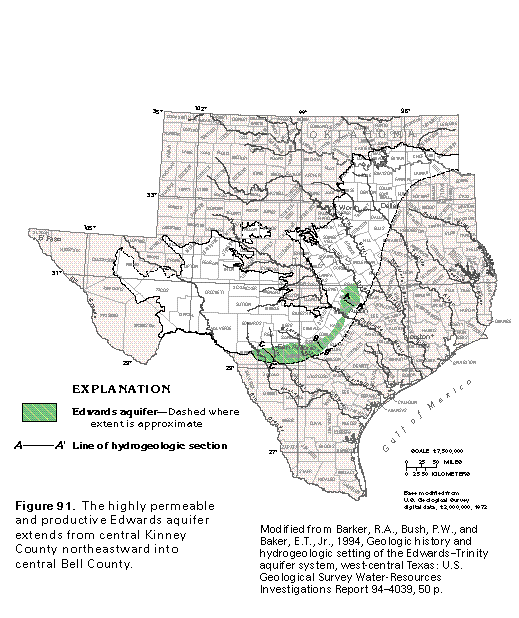
The Edwards aquifer consists of highly faulted and fractured carbonate rocks of Cretaceous age in an area of about 4,000 square miles in south-central Texas (fig. 91). This aquifer is referred to in some reports as the "Edwards (Balcones Fault Zone) aquifer." Most of the aquifer is within the Coastal Plain Physiographic Province, although some updip areas are in the Great Plains Physiographic Province.
The area underlain by the Edwards aquifer is a combination of agricultural and ranch land and areas of dense population, including the cities of Austin in Travis County and San Antonio in Bexar County. The topography consists of a gently rolling plain to the east and moderately hilly country to the west. The altitude of the land surface ranges from about 500 feet above sea level at the Colorado River at Austin to about 1,500 feet above sea level in Uvalde County.
Average annual precipitation ranges from about 22 inches in the west to about 34 inches in the east. Average annual runoff ranges from about 1 inch in the west to about 6 inches in the northeast. Major streams that cross the area flow southward and southeastward and include the Nueces, the Frio, the Medina, the Guadalupe, the Blanco, the Colorado, and the San Gabriel Rivers.
The aquifer underlies parts of 10 counties and is separated into northern and southern parts by a ground-water divide in about the middle of Hays County. The northern part is called the Austin area and consists of Bell, Travis, and Williamson Counties. The southern part, called the San Antonio area, consists of Bexar, Comal, Hays, Kinney, Medina, and Uvalde Counties. The aquifer also underlies an extremely small part of northwestern Guadalupe County; because pumpage in this county is negligible, it is excluded from further discussion.
The 1985 population in the three-county Austin area was about 810,000. During 1985, withdrawals from the Edwards aquifer in the Austin area were about 17 million gallons per day. The six-county San Antonio area had a 1985 population of about 1.3 million. Withdrawals from the Edwards aquifer in the San Antonio area during 1985 were about 450 million gallons per day. The city of San Antonio, which has a population of nearly 1 million, derives its entire water supply from the Edwards aquifer.
HYDROGEOLOGIC FRAMEWORK
The Edwards aquifer consists of limestone and dolomite of the Washita and the Fredericksburg Stages. The complex nomenclature and lithologic character of the formations that compose the aquifer are generalized for purposes of this Atlas, but are discussed in detail in several of the reports listed in the "References" section. The aquifer generally consists of the Kainer and the Person Formations of the Edwards Group and the Georgetown Formation (fig. 80).
After deposition of Cretaceous rocks in west-central Texas, tectonic movement caused the relative uplift of the Edwards Plateau and subsidence of the Gulf of Mexico. Structural forces caused deformation and fracturing of the rocks, and a number of en echelon, northeastward-trending faults formed in the region known as the Balcones Fault Zone. The numerous faults have formed wedges or blocks of rock that are generally downthrown to the south and southeast in the form of stairsteps. The Edwards aquifer is generally coincident with the fault zone. The length of the arc-shaped aquifer is about 240 miles. The northern boundary is in central Bell County where the thickness of the aquifer and its importance as a source of ground water are diminished.
The width of the aquifer ranges from about 4 miles at the Colorado River at Austin to about 30 miles in Medina and Williamson Counties. The updip boundary of the aquifer in most places is the farthest updip extent of the Edwards Group, except in the westernmost area where the updip boundary is determined by a decreased incidence of faulting. From Kinney County eastward and northward to the Colorado River at Austin, the updip boundary generally coincides with the Balcones Escarpment.
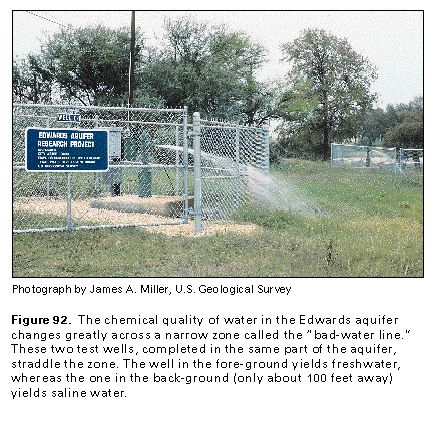
The downdip boundary of the aquifer is largely fault controlled. As a result of the faulting, the chemical quality of the water in the Edwards aquifer can change abruptly in a very short distance across a zone often referred to as the "bad-water line." Along this line, the water is fresh on the upthrown side of a fault and very saline (usually a sodium- or calcium-sulfate type water) on the downthrown side (fig. 92). The downdip boundary of the aquifer in the San Antonio area is the downdip extent of water that contains less than 1,000 milligrams per liter of dissolved solids, whereas in the Austin area, it is the downdip extent of water that contains less than 3,000 milligrams per liter of dissolved solids.
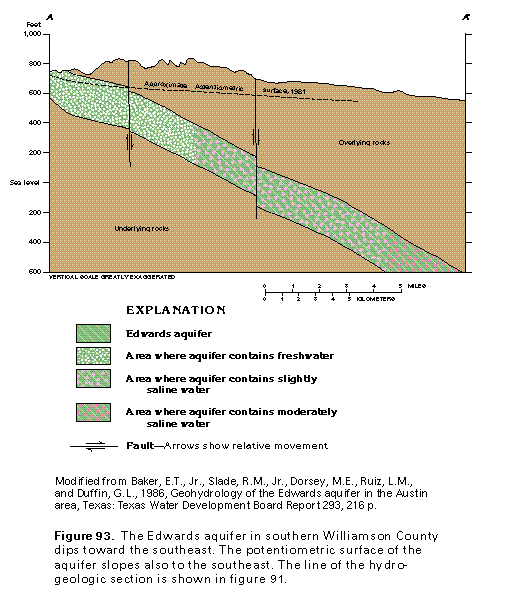
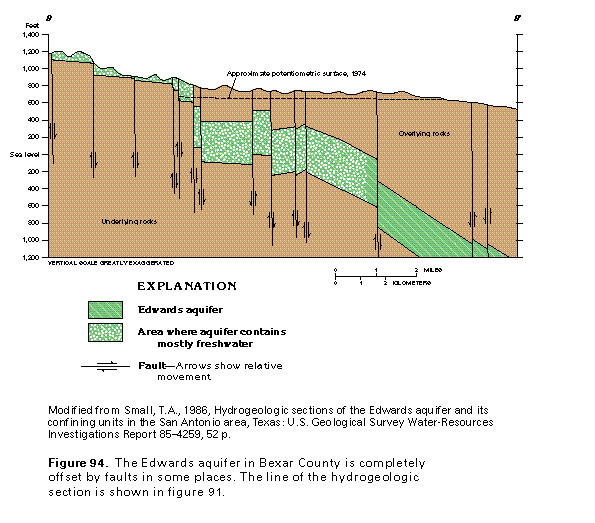
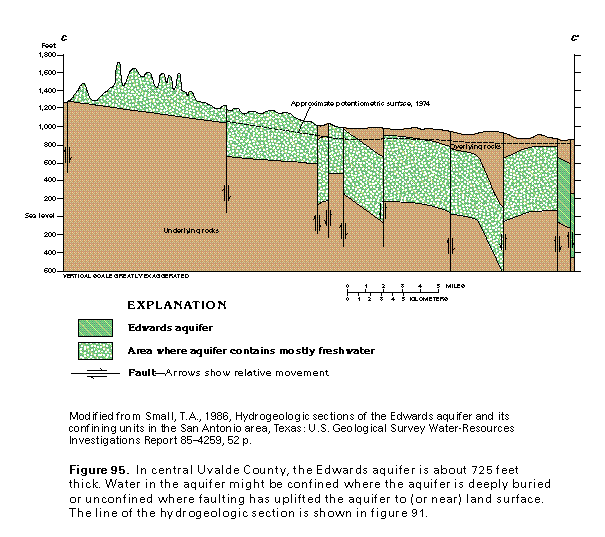
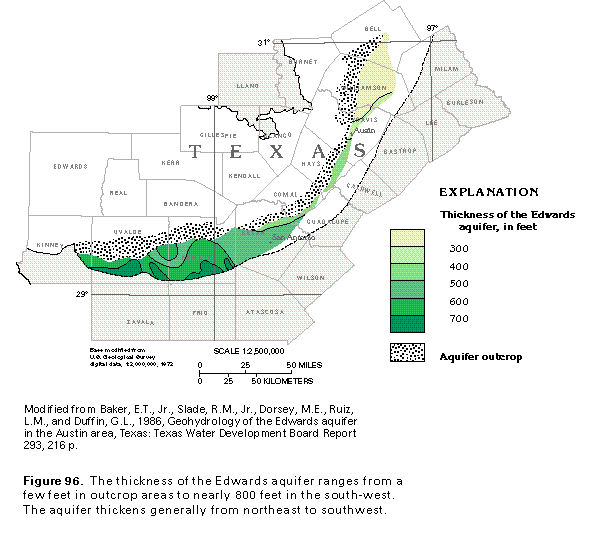
The Edwards aquifer is underlain by the much less permeable Walnut Formation or Glen Rose Limestone of the Trinity aquifer. Where the Edwards aquifer does not crop out, it is confined above by the Del Rio Clay (fig. 80). The aquifer dips to the south and southeast, and is offset by numerous faults (figs. 93, 94, and 95). The aquifer thickens from northeast to southwest and ranges in thickness from a few feet in outcrop areas to about 800 feet in Medina and Uvalde Counties (fig. 96).
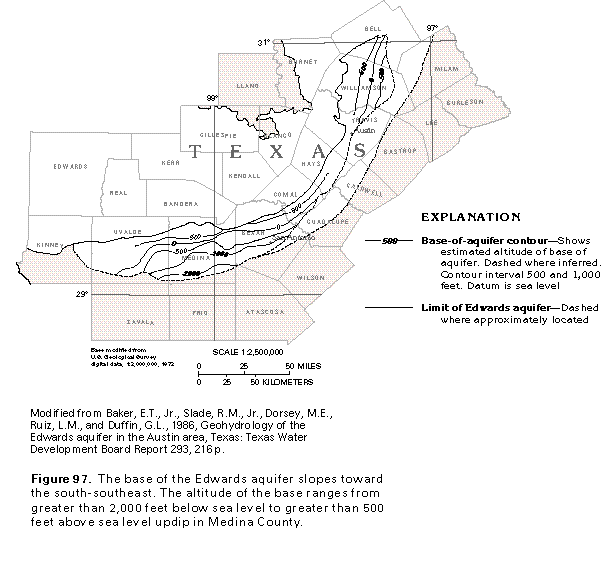
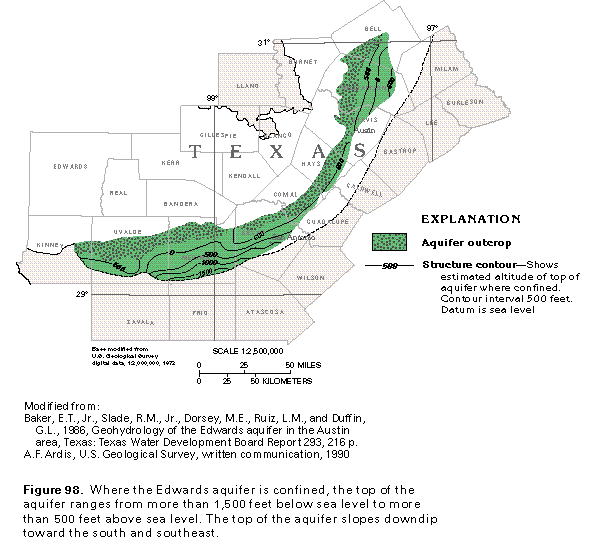
The base of the aquifer slopes generally to the south and southeast. The altitude of the base ranges from more than 2,000 feet below sea level in the south to more than 500 feet above sea level in updip areas (fig. 97). The top of the aquifer, where it is confined by the Del Rio Clay, ranges from 1,500 feet below sea level in the south to more than 500 feet above sea level (fig. 98).
GROUND-WATER MOVEMENT, RECHARGE, AND DISCHARGE
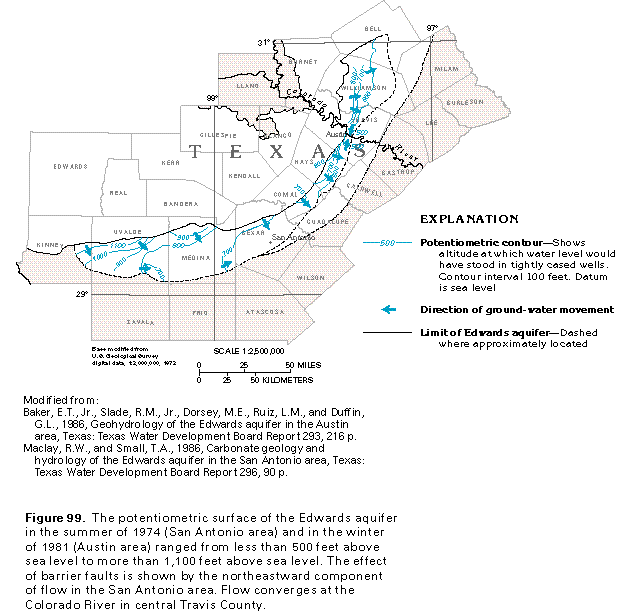
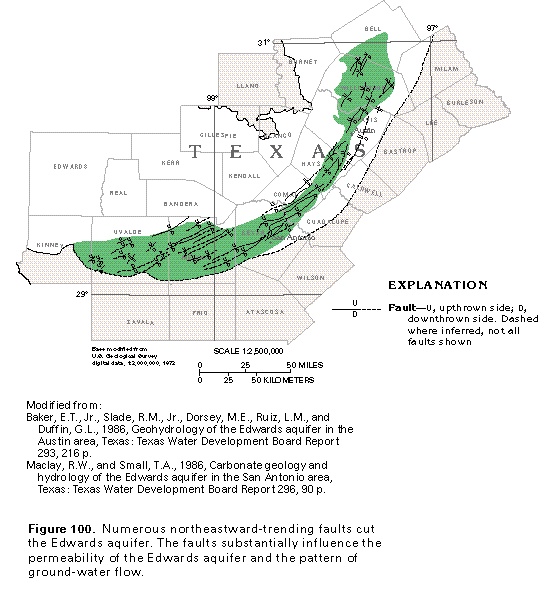
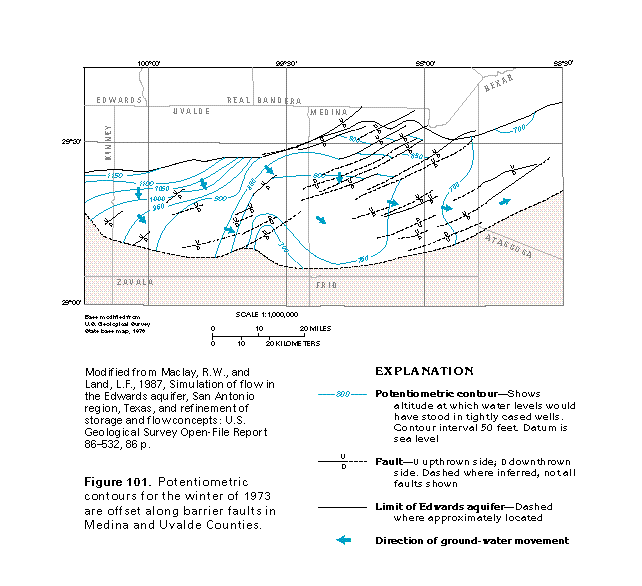
The generalized altitude of the potentiometric surface in 1974 (San Antonio area) and 1981 (Austin area) ranged from less than 500 feet above sea level at the Colorado River to more than 1,100 feet above sea level in Uvalde and Kinney Counties (fig. 99). Ground-water movement is generally downdip, but in the San Antonio area, flow in the confined zone is toward the east and northeast where numerous northeast-ward-trending faults have a substantial influence on the direction of ground-water flow (fig. 100). Vertical displacement of the aquifer along faults may place rocks of high and low permeability opposite each other (figs. 94 and 95) and, thus, may create a partial or total barrier to the normal downdip flow of ground water. In places, flow is diverted to a direction that approximately parallels the faults. The effect of barrier faults on the potentiometric surface and the direction of ground-water movement is shown in more detail for Medina and Uvalde Counties in figure 101.
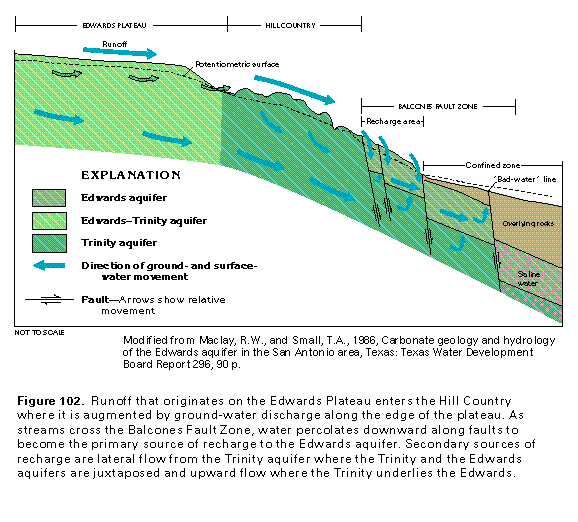
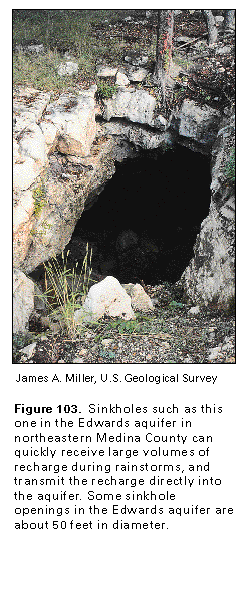
The faults and fractures also serve as points of entry for recharge, as illustrated in figure 102. Runoff that originates on the Edwards Plateau is augmented by ground-water discharge along the eroded edge of the Plateau. As streams cross the Balcones Fault Zone, water percolates downward along the faults where permeability might be greatly enhanced by partial dissolution of limestone. Secondary sources of recharge are direct infiltration of precipitation that falls on aquifer outcrop areas, internal flow of ground water from the Trinity aquifer where the Edwards and the Trinity aquifers are juxtaposed, and upward leakage from the underlying Trinity aquifer where an upward vertical head gradient exists. Direct recharge to the aquifer can be quite rapid through sinkholes (fig. 103).
Water levels in wells completed in the Edwards aquifer rise immediately and springflows increase quickly after major recharge events, thus attesting to a dynamic flow system and the rapid movement of large volumes of water. Because of the great depth of the water table below land surface in most of the area, ground-water losses to evapotranspiration are assumed to be minor. Diffuse leakage into or out of the aquifer also is assumed to be minor. Recharge from streams and precipitation, and discharge from springs and wells can be measured. Thus, an estimated water budget can be computed for the Edwards aquifer for any period for which records are available.
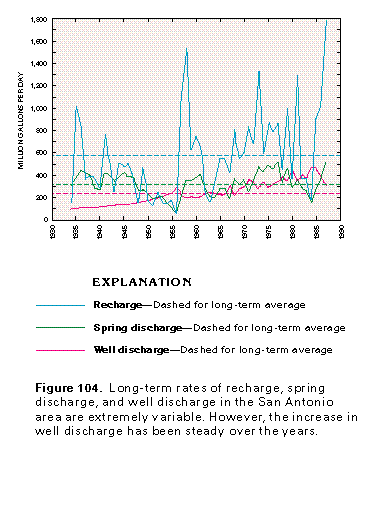
An analysis of long-term (between 1917 and 1987) re-cords provides an estimate of a long-term average water budget for the Edwards aquifer. Total recharge to the aquifer averaged 686 million gallons per day; average discharge to springs was 425 million gallons per day, and well withdrawals averaged 251 million gallons per day for a total average discharge of 676 million gallons per day. Thus, the small net increase in storage of 10 million gallons per day was small. Withdrawals from the aquifer have been increasing over the years and are now substantially greater than the long-term average presented here. This is clearly shown for the San Antonio area by the graph in figure 104.
The water budget varies considerably from the average during any given month or year, depending largely on the amount and distribution of precipitation. During 1956, which was the final year of a long drought, recharge to the aquifer was only about 7 percent of the long-term average. In contrast, during 1987, which was an exceptionally wet year, recharge was more than 3 times the long-term average. In years of below-normal precipitation and recharge, the ratio of well discharge to spring discharge tends to increase, and water that is stored in the aquifer may be substantially depleted. For example, during 1980, annual precipitation was about 3 or 4 inches less than average. Recharge was only about 380 million gallons per day, or about 55 percent of the long-term average. Discharge to springs was about 300 million gallons per day and about 460 million gallons per day was withdrawn from wells during 1980. Depletion of water from storage in the aquifer was about 380 million gallons per day.
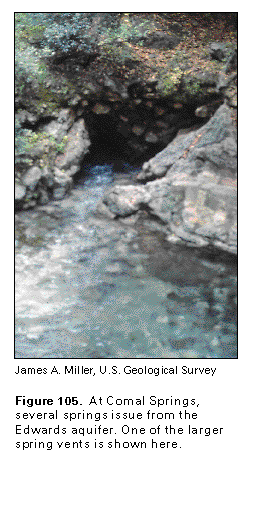
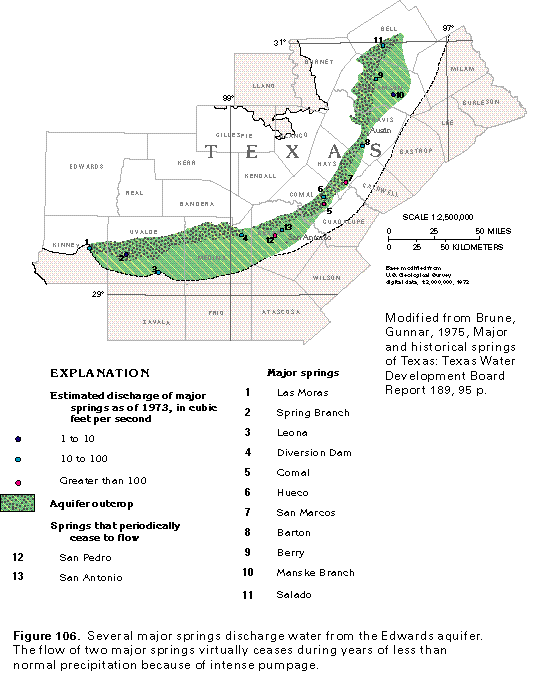
The amount of recharge and discharge varies substantially from county to county within the area because of such factors as topography, streamflow characteristics, soil type, geology, faulting, solution openings, distribution of precipitation, land-use patterns, and so forth. During 1980, about 70 percent of the total recharge to the Edwards aquifer was in Kinney, Uvalde, and Medina Counties. About 84 percent of the total withdrawal from wells was from Bexar (58 percent) and Uvalde (26 percent) Counties. Nearly 70 percent of the total spring discharge was from two springs: 48 percent from Comal Springs in Comal County (fig. 105), and 22 percent from San Marcos Springs in Hays County. Spring locations are shown in figure 106.
AQUIFER HYDRAULIC PROPERTIES AND WATER QUALITY
The Edwards aquifer is the most transmissive of all the aquifers in Texas and Oklahoma. Estimates of transmissivity values for the Edwards aquifer in most of the San Antonio area range from about 200,000 to 2,000,000 feet squared per day. Variations in transmissivity are considerable over relatively short distances and depend upon the amount of development of solution openings along fractures and faults. Large discharges from springs and from flowing and pumped wells attest to the highly permeable nature of the aquifer.
For 61 years of record, Comal Springs, which is the largest spring that issues from the Edwards aquifer, had an average discharge of 185 million gallons per day; a maximum daily discharge of 434 million gallons per day was recorded on November 25, 1985. Some individual wells operated by the city of San Antonio yield more than 16,000 gallons per minute, which ranks them among the largest-yielding wells in the world. Many species of subterranean aquatic organisms exist in the large solution openings deep within the aquifer; for example, toothless, blind catfish live more than 1,900 feet beneath the land surface and are occasionally discharged from flowing or pumped wells.
The aquifer becomes less transmissive toward the Austin area, particularly north of the Colorado River where the aquifer is thinner and less permeable. Estimated transmissivity values in this area range from less than 2 to about 40,000 feet squared per day.
The average specific yield in the unconfined zone of the Edwards aquifer in the San Antonio area is estimated to be 3 to 4 percent. The storage coefficient in the confined zone is estimated to range from about 1x10⁻⁵ to 1x10⁻⁴. The estimated volume of water in storage in the confined freshwater zone of the aquifer in the San Antonio area is 19.5 million acre-feet (6.4x10 12 gallons).
The concentration of dissolved solids in water from the Edwards aquifer typically ranges from 300 to 1,200 milligrams per liter. The dissolved-solids concentration increases from a few hundred milligrams per liter in the recharge zone to more than 1,000 milligrams per liter at varying distances downdip. The transition from water with a dissolved-solids concentration of 1,000 milligrams per liter to water with a concentration of 3,000 milligrams per liter is generally sharp. The width of this transition zone ranges from less than 1 or 2 miles in most of the area to about 11 miles in Williamson County.
GROUND-WATER DEVELOPMENT
To prehistoric man, Indian tribes, Spanish explorers, cattle drivers, immigrant pioneers, and the present population, the springs and spring-fed rivers and underground water from the Edwards aquifer have been, and continue to be, an attractive and vital resource in this region. Today, many uses compete for water from the aquifer, including public and industrial supplies, agriculture, tourism, and ecosystems associated with the springs and spring-river systems.
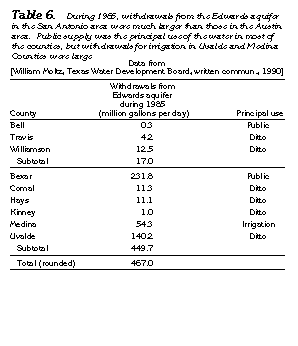
Development of water from the Edwards aquifer has been unequal in a geographical sense. Development in the Austin area has been minor, primarily because of reliance on surface-water supplies for most needs, particularly for the city of Austin. During 1985, ground-water withdrawals in Bell, Travis, and Williamson Counties totaled 17 million gallons per day for mostly smaller public supplies (table 6).
Development in the San Antonio area has been far greater, with a total withdrawal of about 450 million gallons per day during 1985. The largest user of ground water is Bexar County, where about 232 million gallons per day was withdrawn during 1985 (table 6). The city of San Antonio in Bexar County has a population of nearly 1 million and derives its total water supply of about 157 million gallons per day from the Edwards aquifer. Another important use of water from the aquifer in the San Antonio area is for agricultural purposes. During 1985 in Uvalde and Medina Counties, withdrawals, which were mostly for irrigation, totaled about 140 million and 54 million gallons per day, respectively (table 6). Withdrawals in the San Antonio area of about 450 million gallons per day during 1985 were more than four times the rate of withdrawal in the 1930's. The increase in withdrawals was relatively steady from 1934 to 1987 (fig. 104).
A prolonged drought can severely stress the aquifer because of increased ground-water withdrawals. After a prolonged drought that culminated in 1956, regional ground-water levels and springflows reached record lows. Most springs ceased to flow, including Comal Springs where zero flow was recorded from June 13 to November 4, 1956. San Marcos and Barton Springs continued to flow, but at greatly reduced rates. Greater-than-normal precipitation that began in 1957 led to a recovery of water levels and springflow to predrought conditions in less than 2 years (fig. 104).
FRESH GROUND-WATER WITHDRAWALS
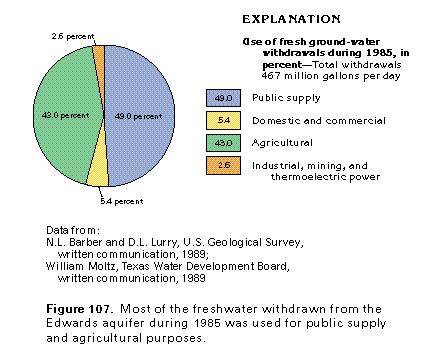
Withdrawals of freshwater from the Edwards aquifer totaled about 467 million gallons per day during 1985 (fig. 107). About 229 million gallons per day was withdrawn for public supply, and about 201 million gallons per day was withdrawn for agricultural purposes. About 25 million gallons per day was withdrawn for domestic and commercial uses, and withdrawals for industrial, mining, and thermo-electric-power uses were about 12 million gallons per day.
POTENTIAL FOR DEVELOPMENT
Although well withdrawals have been increasing over the years, the Edwards aquifer has the capacity to sustain the withdrawals during times of normal or above-normal precipitation. During times of below-normal precipitation, water from storage in the aquifer is temporarily depleted; this water is replenished with the onset of increased precipitation. During times of severe, prolonged drought, concern for declining ground-water levels, decreased springflows, and the possibility of saltwater intrusion from downdip parts of the aquifer is heightened among water managers, government agencies, recreational establishments, conservationists, irrigators, and individuals.
In order to better manage and protect the aquifer, the creation of two local units of government was authorized by the Texas Legislature-the Edwards Underground Water District for the southern area and the Barton Springs/Edwards Aquifer Conservation District for northern Hays and southern Travis Counties. These agencies are empowered to conduct ground-water investigations and to develop comprehensive plans for the protection and most efficient use of the ground-water resource. The tasks of these agencies are often accomplished in cooperation with local, State, and Federal agencies.
Some measures that have been adopted or are in the construction or planning stage to better manage the groundwater resource include educating the public to the need for water conservation and water-quality protection, constructing dams in the recharge zone to collect and hold water for the enhancement of recharge to the aquifer, and constructing reservoirs to impound surface water and, thus, to augment ground-water withdrawals during drought periods. With proper planning and management, and with the cooperation of all concerned, water from the Edwards aquifer will continue to be a vital resource in the area.
Trinity Aquifer
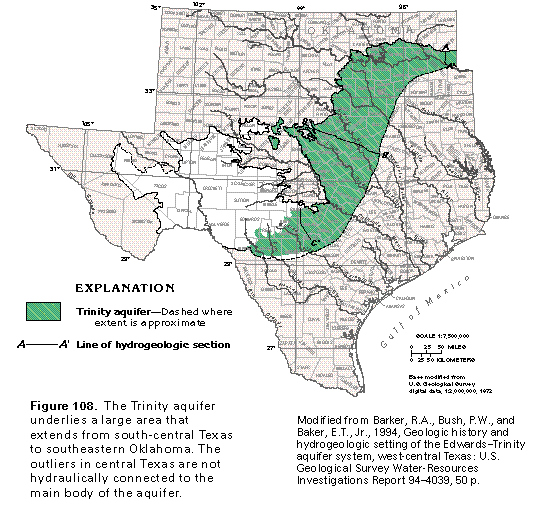
The Trinity aquifer underlies an area of about 41,000 square miles that extends from south-central Texas to southeastern Oklahoma (fig. 108); the aquifer is also in a small area in southwestern Arkansas, as shown in Chapter F of this Atlas. The aquifer consists of interbedded sandstone, sand, limestone, and shale of Cretaceous age. The Trinity aquifer is referred to in many reports as the "Trinity Group aquifer" and the "Antlers aquifer"; the latter name is particularly prevalent in Oklahoma.
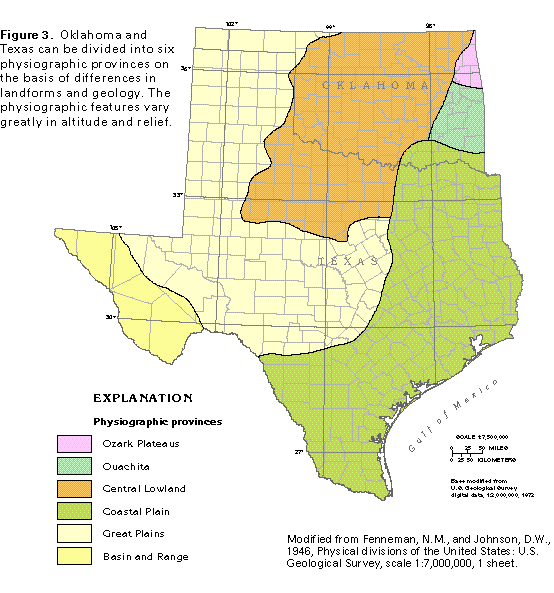
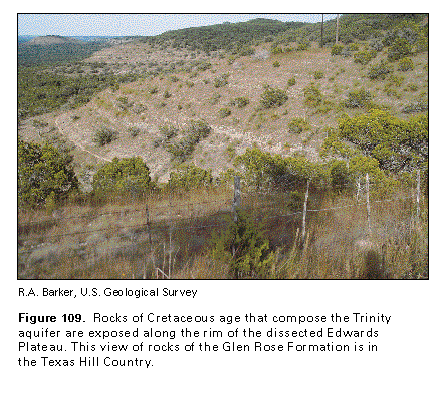
The Trinity aquifer, which underlies all or parts of 68 counties in Texas and Oklahoma, extends from Kinney County, Texas, in the southwest to McCurtain County in southeastern Oklahoma in an arcuate band about 550 miles long. The aquifer is within parts of three major physiographic provinces-the Coastal Plain, the Central Lowland, and the Great Plains (fig. 3). The topography ranges from a gently rolling plain in much of the area to the rugged Hill Country in Texas (fig. 109).
Average annual precipitation ranges from about 21 inches in the south and west to about 51 inches in southeastern Oklahoma. Average annual runoff ranges from less than 0.5 inch in the west to more than 20 inches in southeastern Oklahoma. Rivers that drain the area flow generally southeastward and include the Nueces, the Guadalupe, the Colorado, the Brazos, the Trinity, and the Red.
The Trinity aquifer underlies a densely populated part of Texas, which includes the large metropolitan areas of San Antonio, Austin, Fort Worth, and Dallas. The aquifer is far more important north of Austin, where it provides the total or partial water needs for many cities, towns, industries, and farms.
HYDROGEOLOGY
The Trinity aquifer consists of sandstone, sand, silt, clay, conglomerate, shale, limestone, dolomite, and marl of the Trinity Stage and the Coahuilan Series (fig. 80). The complex nomenclature and lithologic character of the formations that compose the aquifer have been generalized for this chapter, but are discussed in detail in several of the reports listed in the "References" section. The aquifer consists generally of the Hosston and Sligo Formations (absent in northeastern Texas and southeastern Oklahoma) and overlying: (1) Travis Peak or Pearsall Formations and Glen Rose Limestone in the southern area; (2) Travis Peak, Glen Rose, and Paluxy Formations in the central area; and (3) Twin Mountains, Glen Rose, and Paluxy Formations in the northern area (fig. 80).
The Glen Rose Formation is not recognizable north and west of a line that runs through northern Brown, northern Comanche, and eastern Eastland Counties, Tex., north of a line that runs through central Wise, northern Denton, northern Collin, and northern Fannin Counties, Tex., and in southeastern Oklahoma. In these areas, the Paluxy and Travis Peak Formations or the Paluxy and Twin Mountains Formations coalesce to form an undifferentiated unit mostly of sand and sandstone that is referred to as the "Antlers Formation" in many reports.
The width of the Trinity aquifer ranges from less than 10 miles near its southern limit to about 170 miles in the central area. The updip boundary of the aquifer is the farthest updip extent of exposed rocks of the Trinity Stage. The downdip boundary is the approximate downdip extent of water that has less than 3,000 milligrams per liter of dissolved solids.
The aquifer is underlain and confined by low-permeability rocks that range in age from Precambrian to Jurassic. Where the aquifer does not crop out, it is confined above by the Walnut Formation in most of the area. In much of the Balcones Fault Zone, the upper part of the Glen Rose Limestone directly underlies the highly permeable Edwards aquifer.
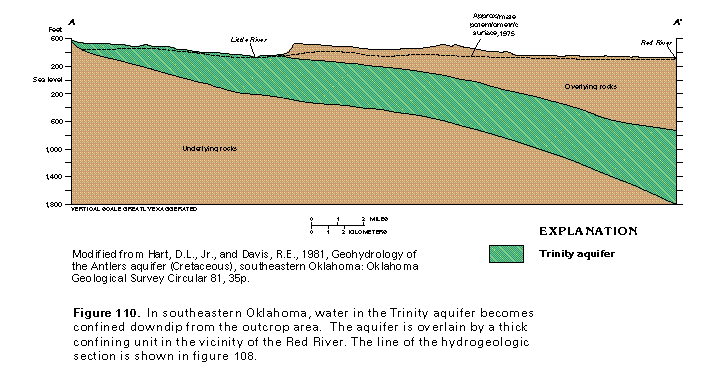
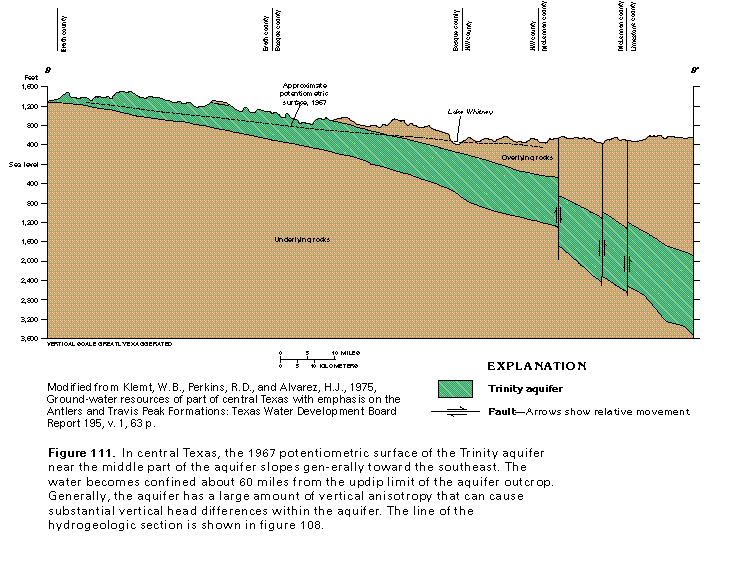
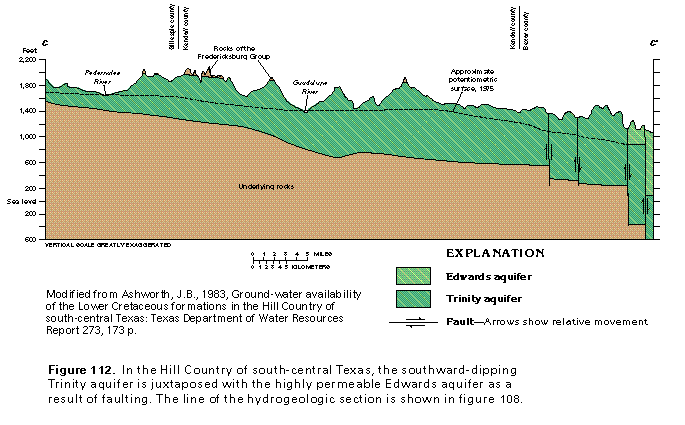
The aquifer dips to the south and southeast (figs. 110, 111, and 112). Downdip parts of the aquifer extend into the Balcones Fault Zone in places and are offset by faulting. The thickness of the aquifer ranges from a few feet in aquifer outcrop areas to more than 1,000 feet in downdip areas. Water with a dissolved-solids concentration of less than 3,000 milligrams per liter may extend to about 3,500 feet below sea level in the aquifer (fig. 111). Data to define the downdip limit of water that has a dissolved-solids concentration of 10,000 milligrams per liter are lacking in this area.
The Trinity aquifer has a large amount of vertical aniso-tropy. This is particularly true in downdip areas where distinct shale facies may separate more permeable formations that lie above and below. For this reason, many published reports describe the hydrology of individual formations or group the rocks into an "upper," "middle," and "lower" Trinity aquifer. In general, the most productive part of the Trinity aquifer is the undifferentiated Trinity Group in the outcrop and adjacent confined part of the aquifer from Brown County, Tex., north-eastward into northeastern Texas and southeastern Oklahoma, and in the Twin Mountains and Travis Peak Formations downdip of the Trinity Group. For purposes of this Atlas, the emphasis of the hydrologic description of the Trinity aquifer is on its most productive parts.
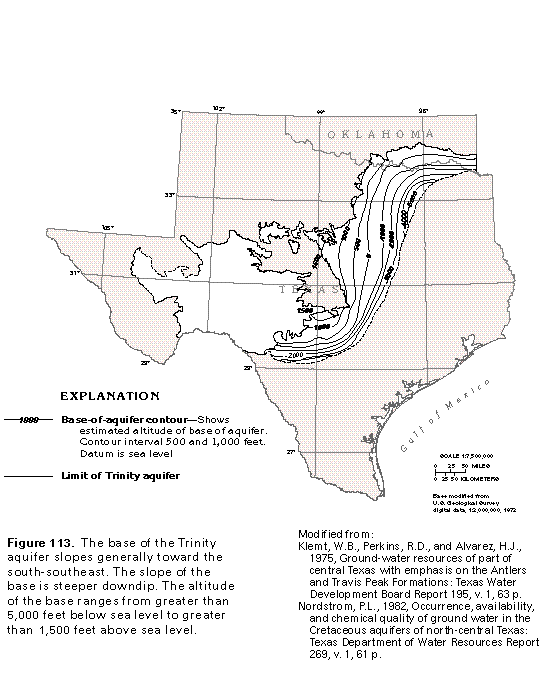
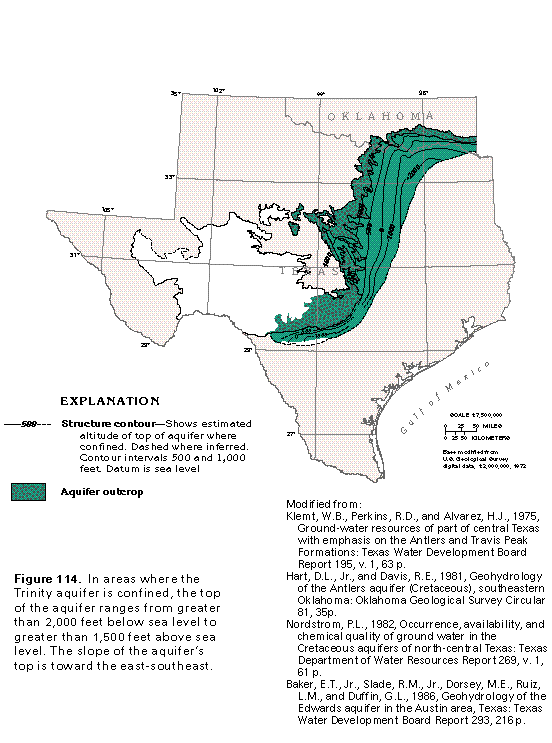
The base of the Trinity aquifer slopes generally to the south and southeast. The altitude of the base ranges from more than 5,000 feet below sea level in the north to more than 1,500 feet above sea level in the west-central area (fig. 113). The top of the aquifer in the confined zone ranges from more than 2,000 feet below sea level in the north to more than 1,500 feet above sea level in the west-central area (fig. 114).
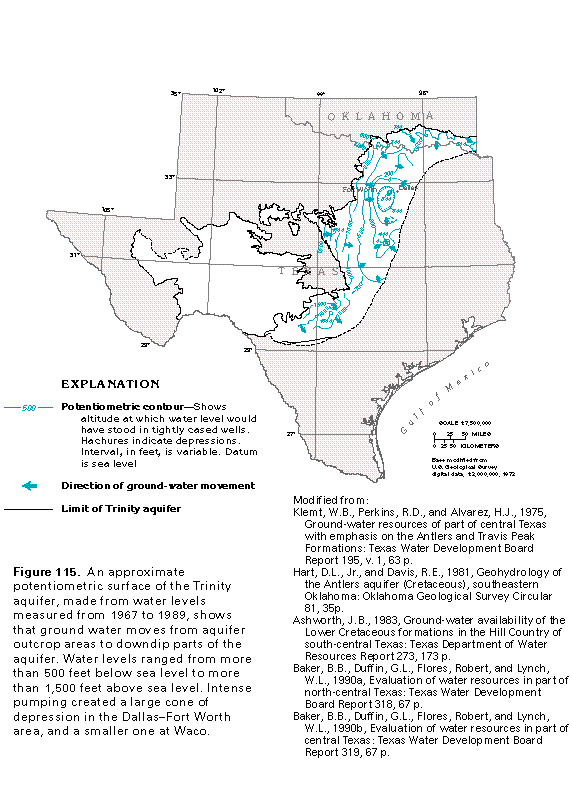
Recharge to the Trinity aquifer is generally as precipitation that falls on aquifer outcrop areas and as seepage from streams and ponds where the head gradient is downward. In the Hill Country, water might flow laterally into the Trinity aquifer from the adjacent Edwards-Trinity aquifer. The aquifer discharges by evapotranspiration, spring discharge, diffuse lateral or upward leakage into shallower aquifers, and withdrawals from wells. A composite, representative potentiometric surface of the Trinity aquifer is shown in figure 115. The potentiometric contours shown in the figure are broken in places because the water levels for different areas were measured over a span of more than 20 years (1967-89) and reflect the effects of pumpage from the aquifer at the time of measurement. Also, the measurement of water levels in different units of the greatly anisotropic aquifer in adjacent areas can show differences in potentiometric surfaces. Water-level altitudes ranged from more than 500 feet below sea level in the Dallas-Fort Worth pumping center to more than 1,500 feet above sea level in central and southern outcrop areas. Ground water moves generally downdip and toward cones of depression developed around pumping centers.
Depths of wells completed in the Trinity aquifer commonly range between 50 and 800 feet, but some well depths exceed 3,000 feet; the deeper wells are in the confined zone; Wells commonly yield from 50 to 500 gallons per minute, and some yield as much as 2,000 gallons per minute. The concentration of dissolved solids in the water typically ranges from 500 to 1,500 milligrams per liter.
The transmissivity and hydraulic conductivity of the anisotropic Trinity aquifer can vary greatly within a geologic unit and among different units, as shown in table 7. The number of aquifer tests shown in the table is an indicator of which units and which areas are the most developed and productive. For the entire area, the transmissivity of the Trinity aquifer ranges from about 80 to 5,700 feet squared per day, the hydraulic conductivity ranges from about 1 to 31 feet per day, and the storage coefficient ranges from about 2x10⁻⁵ to 0.026. Because the materials that compose the aquifer are generally fine grained, clayey, and locally cemented, the transmissivity and hydraulic conductivity values are relatively low. Nevertheless, the aquifer is important and productive, particularly in eastcentral and northeast Texas.
GROUND-WATER DEVELOPMENT
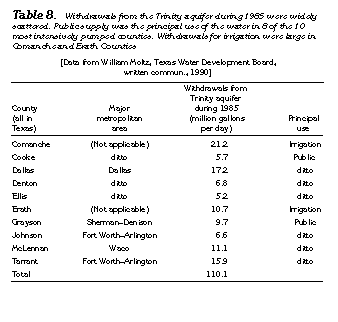
Since the beginning of development of the Trinity aquifer, water levels have declined hundreds of feet in the artesian zone in east-central and northeast Texas, including large areas of Dallas, Denton, Ellis, Grayson, Hill, Johnson, McLennan, and Tarrant Counties. Seven of these counties are among the 10 where withdrawals from the Trinity aquifer were greatest in 1985 (table 8). Withdrawals in this area of large water-level declines are mainly for public supply. The large declines have resulted from a combination of large withdrawals, low permeability and transmissivity of the aquifer, and distance from the aquifer outcrop or recharge area.
Water-level declines have been especially large in eastern Tarrant County where withdrawals by smaller cities in the Dallas-Fort Worth area caused declines of more than 550 feet between 1955 and 1976. Many ground-water users in the Dallas-Fort Worth area have converted to surface-water supplies. The area with the 550-foot water-level decline experienced a water-level rise of more than 100 feet between 1976 and 1989. However, this does not reflect a large regional recovery of ground-water levels, but rather a shifting pattern of ground-water use as water-level declines continue in other areas.
Another area of especially large water-level decline in the Trinity aquifer is in McLennan County where the city of Waco and its suburbs withdraw ground water for public supply. Water levels in the aquifer declined more than 300 feet between 1900 and 1967, and another 400 feet between 1967 and 1988.
Although Comanche and Erath Counties in east-central Texas withdraw considerable amounts of water from the Trinity aquifer principally for agricultural purposes (table 8), they are located mostly on the outcrop of the aquifer, where recharge from natural sources and irrigation return flow readily occurs. Thus, ground-water level declines in these areas are not great. Water from the Trinity aquifer is used in other areas, including southeastern Oklahoma and the Hill Country of south-central Texas, but not as intensively as in the areas described above.
FRESH GROUND-WATER WITHDRAWALS
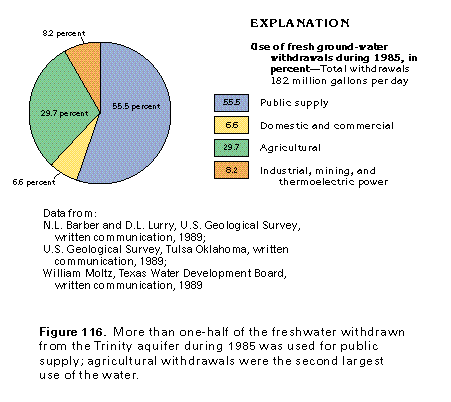
Withdrawals of freshwater from the Trinity aquifer totaled about 182 million gallons per day during 1985 (fig. 116). About 101 million gallons per day was withdrawn for public supply, the principal water use. About 54 million gallons per day was withdrawn for agricultural purposes, and about 15 million gallons per day was withdrawn for industrial, mining, and thermoelectric-power uses. Withdrawals for domestic and commercial uses were approximately 12 million gallons per day.
POTENTIAL FOR DEVELOPMENT
The part of the Trinity aquifer in Oklahoma has considerable potential for future development. Potential recharge to the aquifer is far in excess of usage. Withdrawals from the aquifer in this area are small (less than 6 million gallons per day) because of an abundance of available surface water.
The Trinity aquifer has been intensively developed in northeast and east-central Texas. Ground water has been favored over surface-water sources to supply the needs of cities, towns, and industries because of the great expense of reservoir construction, transmission lines, and treatment facilities associated with the latter. However, annual withdrawals from the aquifer have far exceeded annual replenishment from recharge, resulting in continued declines of ground-water levels and depletion of ground water in storage.
Over the last several years, the trend has been away from ground-water use and toward surface-water use. An effective management scheme could utilize the ground- and surfacewater resources so that the benefits derived from each are optimized. One method is to extend the usability of the aquifer by increasing the amount of recharge to it. This could be done by the use of runoff control structures in the outcrop area to retard runoff and allow more time for it to percolate downward to the water table. For the downdip or confined part of the aquifer, surface water, when available and of suitable chemical quality, could be used to recharge the aquifer through injection wells.
In the Hill Country, the largest yields from wells completed in the Trinity aquifer are in the outcrop areas of the lower part of the Glen Rose Limestone and the upper part of the Travis Peak Formation. Areas near creeks may have better development of the solution channels that are necessary for large yields. Careful planning is needed to construct a well properly for its intended purpose and yield, and wells need to be spaced properly to avoid ground-water depletion that results from overly concentrated pumpage.