USGS Response to an Urban Earthquake -- Northridge '94
Damage to the Built Environment
The vast majority of losses to property and lives caused by an earthquake
involve manmade structures and the people inside. It is often said, Earthquakes dont kill people, buildings do.
Because the Northridge earthquake struck directly in an urbanized environment, effects on buildings and highway
structures were strikingly clear. All NEHRP agencies undertook studies to understand the extent and causes of failures
of buildings and freeway structures. The USGS performed detailed analyses of instrumented buildings, studies of
aftershocks recorded in heavily damaged structures, and interpretations of the large amount of data on building
damage.
How Instrumented Buildings Performed
The USGS studied three significant buildings that were tested by strong
shaking during the Northridge earthquake. The University of Southern California (USC) Hospital building in Los
Angeles, about 35 kilometers from the fault, is a base-isolated structure. The Olive View Hospital (OVH) building
in Sylmar, 7.3 kilometers from the fault, is a conventionally designed building that replaced the structure that
was severely damaged in the 1971 San Fernando earthquake and later razed. Both buildings contained large arrays
of instruments placed to assess accelerations and displacements throughout the buildings and to compare with the
shaking of the nearby ground. The study also assessed the effects of the Whittier Narrows earthquake of 1987 on
the OVH building for comparisons with the Northridge event. The Holiday Inn in Van Nuys was constructed in 1966,
and experienced the effects of the 1971 San Fernando and 1994 Northridge quakes. This building suffered minor damage
in 1971, but sustained major structural damage in 1994.
The Base-Isolated USC Hospital Building
The USC Hospital is an 8-story building with many isolators that act like
shock absorbers to damp out strong ground shaking. The building contains 149 isolators that support a steel superstructure
on continuous concrete spread footings. Diagonally braced perimeter frames, supported by 68 isolators, were designed
to carry the lateral loads and the internal columns that carry the vertical load were supported by 81 isolators.
The building, within 15 kilometers of the Newport-Inglewood fault zone, was designed for a maximum relative isolator
displacement of 26 centimeters, and to meet the seismic standards of the 1988 and 1994 Uniform Building Code (UBC).
The motions recorded at the top of the isolators and at the roof were smaller than
those recorded below the isolators and in the free field (a ground site away from and free of the influences
of the building). These findings provide clear evidence that the isolators were effective in dissipating the vibrational
energy traveling from the free field to the building. In general, the shapes of the spectra of recorded components
of motions are well enveloped by the building code spectrum, except for some high frequency (>1 hertz) bands
for which the code spectrum is exceeded. Accelerations at various levels of the building, and the amplitude spectra
and relative displacements of the isolators confirm excellent performance throughout the building. Drift ratios
(displacements within a building story at the top relative to the base) reached only 10% of allowable values
explaining why there was little damage to the structure or its contents. However, the ground motions at this site
were only moderately strong. USGS studies showed that displacements near the seismogenic fault of the Northridge
quake would exceed the designed displacement range for the isolators. Therefore, the performance of the isolators
could be a problem at the USC Hospital should shaking be stronger than that of the Northridge earthquake.
| Base-isolated buildings are a relatively recent addition to U.S. earthquake-resistant
design strategies. In base-isolated structures, the building is insulated from strong ground motion by energy-absorbing
systems between the building and its foundation. Such buildings are still uncommon because the design concept had
not been tested by severe earthquakes prior to the Northridge event. |
|

Lessons Learned
The structural responses derived from strong-motion recordings in buildings
actually shaken by earthquakes can be compared to the theoretical responses that were used in designing the structures.
These comparisons may verify the calculations and the stability of the design, or they may point to problems that
need to be corrected in future construction. Performance of the USC Hospital building showed that design improvements
are needed for the type of base-isolation system used in the building.
|
| Prior to the Northridge earthquake, structural engineers believed that modern
buildings constructed with specially designed steel frames could resist very intense ground motions with only limited
structural damage. However, during the earthquake, the steel framing of more than 100 such structures experienced
fractures. The fractures initiated at the welded connections between the beams and columns of the frames. These
fractures were initially attributed to poor quality workmanship in the welding of the connections. However, a review
of historical test data and tests performed immediately following the earthquake demonstrated that connections
with standard quality workmanship were vulnerable to the fractures. Many of the damaged buildings were at sites
that experienced ground motions approximating those adopted by the building code as a basis for design. Consequently,
the adequacy of the building code provisions was immediately questioned, and the International Conference of Building
Officials (ICBO) adopted an emergency code change in October 1994. The ICBO action prompted the creation of a joint
venture among the Structural Engineers Association of California (SEAOC), the Applied Technology Council (ATC),
and the California Universities for Research in Earthquake Engineering (CUREE). The joint venture, simply named
SAC, initiated a program to resolve the issues related to the steel-frame damage, and to publish advisories and
guidelines. SAC published several interim documents during 1995 to assist engineers and building officials in design
and inspection activities while reliable new building codes were being developed for steel-frame buildings. This
effort was funded by the Federal Emergency Management Agency (FEMA). |
The Olive View Hospital Building
The OVH building was designed in 1976 to withstand increased levels of
seismic forces based on the disastrous fate of its predecessor. The structural system for resisting lateral forces
is a mixed design of concrete and steel shear walls. The foundation consists of spread footings and concrete slab-on-grade
for the ground floor. The ground floor and second floor are typically built of concrete shear walls 25 centimeters
thick that extend along several column lines. At the third level, the plan of the building changes to a cross shape,
making a 4-story tower with steel shear walls surrounding the perimeter.
USGS engineers examined the buildings performance by using data from both the Northridge and Whittier Narrows
earthquakes for comparisons. The building was designed for two levels of performance. The first level, 0.52g, represented
accelerations at which the building would not be badly damaged. The second level, 0.69g, represented accelerations
at which the building would survive, perhaps with major damage but without catastrophic failure.
Data from sensors in the OVH building show that the building escaped the impact of long-period (>1 second)
pulses generated by the Northridge quake. The OVH records indicated that very large peak accelerations at the ground
level (0.91g) and the roof level (2.31g) were accommodated by the building without structural damage. Analyses
of the data indicate that the structure was in resonance at frequencies between 2.5 and 3.3 hertz. These frequencies
are also within the site-response frequencies of 2-3 hertz, calculated from examining the geological materials
upon which the structure was built. The effective structural frequencies derived from the Northridge and Whittier
earthquakes data are different and exhibit variations attributable to nonlinear effects. One effect is soil-structure
interaction which was seen to be more pronounced during the Northridge event. The building possibly experienced
rocking at 2.5 hertz in the north-south direction during that event, and there is the possibility that radiation
damping (wherein the building dissipates energy into the surrounding soil) contributed to reducing that response.
Damping ratios for the building were 10%-15% (north-south) and 5%-10% (east-west) for the Northridge effects, and
1%-4% (north-south) and 5%-8% (east west) for the Whittier effects. These nonlinear effects that tended to reduce
the shaking of the building during large ground motions are consistent with the different damping ratios observed
during the Northridge and Whittier Narrows events. There was also nonlinear behavior due to minor structural damage
during the Northridge earthquake. It is also likely that the cruciform wings responded with a different frequency
than that of the overall building.
The Olive View Hospital building was conceived and designed as a very strong and stiff structure, particularly
in response to the disastrous performance of the original OVH building during the 1971 San Fernando earthquake.
However, the resulting design placed the fundamental frequency of the building within the frequency range of the
site (2-3 hertz), thereby producing conditions for resonance. This case study indicates that determining the site
frequencies needs to be emphasized in developing design response spectra. Despite the site resonances, the performance
of the OVH building was considered to be a great success during the Northridge event. The hospital sustained no
structural damage under very strong shaking (greater than 2g) at the roof level.
|
Lessons
Learned
The stiff design of the Olive View Hospital performed very well during the
Northridge earthquake, probably saving many lives in a region of very intense shaking. Although the structure did
not sustain damage, the hospital had to be evacuated because of broken water pipes and other secondary damage.
These elements of the interior design need to be improved in anticipation of future earthquakes.
|
The Holiday Inn in Van Nuys
The Holiday Inn in Van Nuys is a 7-story, reinforced concrete building
built in 1966. The earthquake resistance system consists of frames around the perimeter, and a foundation of concrete
pilings. The building was instrumented with three accelerographs prior to the 1971 San Fernando earthquake and,
thereafter, with 16 accelerometers that recorded the Northridge quake. The building is located approximately the
same distance from the seismogenic faults of both earthquakes (see p. 18). During the San Fernando earthquake,
the building suffered minor damage that was mostly nonstructural. During the Northridge event, however, the building
suffered extensive structural damage. USGS scientists used the records from both earthquakes to determine reasons
for the difference in the amount of damage.
The peak ground-level accelerations for the San Fernando earthquake were 0.25g, 0.14g, and 0.17g in north-south
(transverse), east-west (longitudinal), and vertical directions, respectively. The corresponding values for the
Northridge quake were 0.42g, 0.44g, and 0.28g. The peak roof displacements relative to the ground for the San Fernando
quake were 15 centimeters in the north-south direction and 8 centimeters in the east-west direction. For the Northridge
quake, the peak north-south displacements were 17 centimeters for the east end of the building, and 23 centimeters
for the west end. The peak east-west displacement of the roof with respect to the ground was 23 centimeters. The
large difference between the east- and west-end displacements indicated a significant amount of torsion in the
building. Using data from roof sensors, USGS engineers determined that the building was rotating with respect to
a center near its east end during the Northridge event. The building lacked sufficient instruments during the San
Fernando event to record comparative torsional modes.
USGS engineers analyzed response spectra for the building for the San Fernando and Northridge earthquakes. The
analysis showed that the building responded with much larger amplitudes to the Northridge quake than to the San
Fernando quake, and that the response spectra for the Northridge event exceeded the Uniform Building Code (UBC)
response spectra. Ground-to-roof transfer functions showed that the north-south vibrations of the building were
coupled with torsion in both earthquakes. The dominant frequency of this mode was near 0.7 hertz. The east-west
vibrations had dominant frequencies of 0.9 hertz during the San Fernando earthquake and 0.5 hertz during the Northridge
event. The Northridge frequencies are those after failure of the fourth-floor columns.
Ground-motion data to support the investigations described on pages 48-53 were obtained in part from the California
Division of Mines and Geology (CDMG) strong motion instrumentation program (see p. 24).
|
Lessons Learned
The Holiday Inn in Van Nuys was severely damaged during the Northridge earthquake,
after suffering only minor damage in the 1971 San Fernando earthquake. Reasons for the different responses were
essentially due to the stronger shaking at this site during the Northridge quake. The building was subject to significant
torsion during the Northridge event, and the spectral response of the building exceeded that of both the San Fernando
earthquake and the Uniform Building Code.
|
The Collapse of the Interstate-5 / State Highway-14 Interchange
The collapsed I-5/SH-14 interchange (see cover) was one of the most spectacular
and costliest damage sites resulting from the earthquake. To determine what happened at the site, USGS scientists
deployed instruments on the standing sections of the interchange bridges and on the surrounding ground at the bases
of pier supports. The instruments were used to obtain aftershock records for (1) determining the dominant vibrational
modes in which the bridges responded to shaking, and (2) estimating the main-shock motions responsible for the
collapse.
Using accelerations and velocities from the four largest aftershocks, USGS engineers calculated ground-to-deck
transfer functions. These functions defined the transfer of vibration from the ground to the bridge deck
in the horizontal and vertical directions, and longitudinally along the bridge spans. Different methods for calculating
the functions gave consistent estimates of dominant frequencies of the deck0.4, 0.7, and 3.2 hertz in the horizontal,
longitudinal, and vertical directions, respectively.
Because there were no strong-motion instruments at the bridge to record the shaking, engineers used innovative
methods to estimate the main-shock motions that caused the collapse. One method used relations between the main
shock and aftershocks determined for three nearby strong-motion stations. Aftershock motions from the bridge structures
were then scaled by these relations, giving consistent estimates of ground motions at the bridge from the main
shock. The response spectra showed very large amplitudes, particularly for the longitudinal direction, for periods
less than 1 second. The peak spectral amplitudes calculated for the main shock were three to four times the design
spectra in this period range.
The methods used here were an attempt to demonstrate using aftershock recordings to estimate main-shock motions.
Much more detailed analysis of connectors, local geology, and other factors would be needed to determine, for example,
why the collapse occurred on the lower rather than the higher sections of the structure.
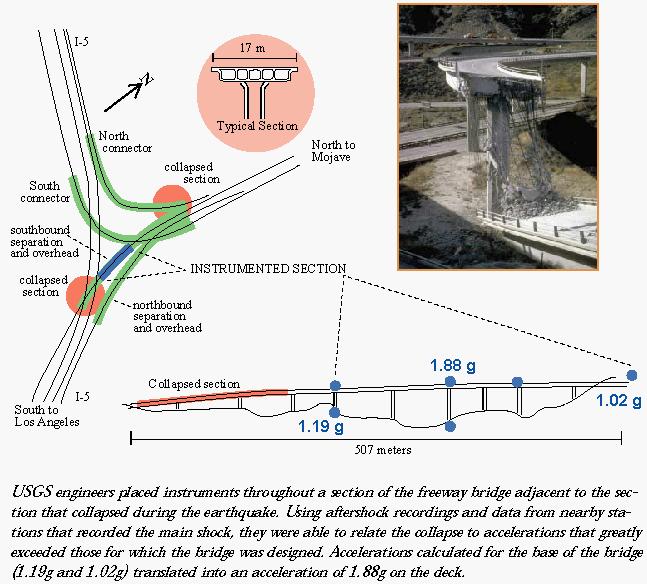
USGS engineers placed instruments throughout a section of the freeway bridge adjacent to the section that
collapsed during the earthquake. Using aftershock recordings and data from nearby stations that recorded the main
shock, they were able to relate the collapse to accelerations that greatly exceeded those for which the bridge
was designed. Accelerations calculated for the base of the bridge (1.19g and 1.02g) translated into an acceleration
of 1.88g on the deck. The 1.88g value represents conditions of the failed structure, and not those of the original
continuous structure.
Larger Than Expected Ground Motions and Issues of Earthquake Engineering
USGS scientists studied more than 250 ground-motion records from major
networks operated by the USGS, the California Division of Mines and Geology (CDMG), and the University of Southern
California (USC), and smaller networks such as one operated by the Los Angeles Department of Water and Power. In
general, peak accelerations exceeded those predicted by attenuation relations for California. At several locations,
horizontal peaks were close to or exceeded 1g, and at one station, the peak vertical acceleration exceeded 1g.
The largest horizontal peak acceleration of a free-field site was 1.78g recorded in Tarzana (see p.29).
The ground-motion data indicated a general trend of higher peak accelerations from the Northridge earthquake
than for those of other California earthquakes of similar magnitude. This trend may be attributable to the thrust
mechanism and the effects of directivity (see p.12). Ground motions both near and far from the epicenter contained
consistent high-energy pulses of relatively long duration, a cause for concern about the vulnerability of mid-rise
to highrise steel structures designed for lesser motions. Additionally, there were significant site effects contributing
to the overall picture of unexpected ground motions.
|
The Myth of Unusual Vertical Motions
Following the Northridge earthquake, there were statements by engineering
and other professionals to the effect that much of the structural damage was caused by unusual vertical motions.
This is not true. The ratio of horizontal to vertical shaking was similar to that of past earthquakes. One factor
that contributed to the misconception was that vertical shaking is always stronger in the epicentral region. For
the Northridge event, there were many structures in the epicentral region that were subjected to strong (but not
unusual) vertical motions.
|
The strong-motion records show that long-duration pulses contributed to the large accelerations that damaged numerous
mid-rise and highrise buildings. Long-duration pulses produced large ground velocities and displacements. Consequently,
significant percentages of wave energy were transmitted to structures within the duration of the pulses, which
commonly were within the 1-5 second period common to most of the buildings. Ground-velocity records analyzed for
stations 10, 16, and 20 kilometers from the epicenter indicate that buildings need higher strength and larger ductility
(flexibility of a structure) to accommodate the velocities without damage.
|
Lessons Learned
The shapes of the response spectra of motions at many sites exceeded the
Uniform Building Code (UBC) spectra beyond T>0.5 seconds for soil-like sites (called S2 in the UBC). Many
motion spectra from rock-like (S1) sites exceed the UBC spectra in the short-period range. The averages of the
normalized spectra are enveloped reasonably well by the UBC design-response spectra for either S1 or S2 sites.
The standard deviation above the average is significant, however, for S1 sites. Therefore, a spectral peak of 3.0
(compared to the current value of 2.5) for the 0.1-0.5 second range of building response should be used for S1
sites, and similar increases are proposed for S2 sites. Sites that experienced unusually high accelerations, such
as in Newhall and Tarzana, bear further consideration as to special designs to accommodate such accelerations.
|
Predicting Building Damage and Loss
The California Office of Emergency Services (OES) compiled a detailed
data set on building damage throughout southern California (see p. 8). The data set identifies the types, geographic
distribution, and damage, if any, of buildings that were inspected and tagged throughout Los Angeles County.
The data set is separated into 12 building categories differentiated by date and type of construction. USGS scientists
used the data set to map shaking intensity in the county and to develop a method for predicting future damage and
loss from earthquakes.
Scientists selected seven building categories to give the most complete areal coverage for the analysis. Five
of these categories were wood-frame residential structures comprising pre- and post-1940 single-family, pre- and
post-1940 2- to 4-family, and post-1940 multifamily dwellings. The other two categories were 1940-76 and post-1976
masonry structures. The data were aggregated by 1990 Census tracts in order to give the highest resolution to the
coverage. In the San Fernando Valley, Census tracts cover about 1.5 square kilometers on the average, and in downtown
Los Angeles, they cover about 1 square kilometer. The most densely populated Census tracts contain more than 2,000
residential structures.
USGS scientists developed a mathematical relation that estimates shaking intensity by comparing red-tagged
(no occupancy allowed) buildings in the post-1940, single-family-dwelling category to exposed buildings in a Census
tract. The estimator uses a damage matrix, derived from data from the 1989 Loma Prieta earthquake in northern
California, that predicts the ratio of red-tagged to exposed buildings for Modified Mercalli Intensities (MMI)
in the range V to X (see p. 9). The relation then is modified using damage matrices for other building categories
and for the yellow-tagged (limited entry allowed) and green-tagged (no restrictions on entry) data. The resulting
equation yields a tagging intensity that reflects the utility of the various tags for estimating different
shaking intensity levels. For example, the red tags predict the higher MMI intensities (IX and X+) much more
reliably than the lower intensities.
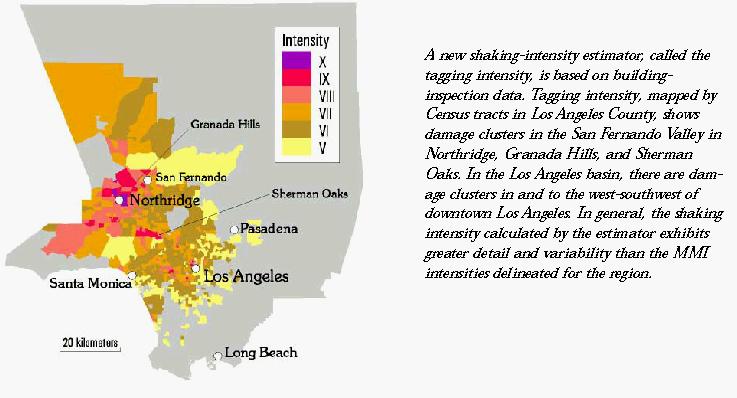
A new shaking-intensity estimator, called the tagging intensity, is based on building-inspection data.
Tagging intensity, mapped by Census tracts in Los Angeles County, shows damage clusters in the San Fernando Valley
in Northridge, Granada Hills, and Sherman Oaks. In the Los Angeles basin, there are damage clusters in and to the
west-southwest of downtown Los Angeles. In general, the shaking intensity calculated by the estimator exhibits
greater detail and variability than the MMI intensities delineated for the region.
The analysis showed that the post-1940 single-family dwellings constitute both the largest building category,
and the strongest in terms of resistance to damage from earthquake shaking. Post-1940 multifamily dwellings proved
to be more susceptible to shaking damages than the categories of masonry buildings or pre-1940 single-family and
2- to 4-family wood-frame dwellings.
|
Lessons Learned
The dense areal coverage of tagging data for Los Angeles County yielded the
most detailed estimates of damage and shaking intensity ever obtained for an earthquake in the United States. Crosscorrelating
damage in seven building categories revealed that the post-1940 multifamily dwellings were more susceptible to
damage than the two masonry-structure categories or the two pre-1940 wood-frame dwelling categories. These results
will strongly condition predictions for building damages and losses from future earthquakes in California.
|
Making Choices About Reducing Earthquake Losses
Current Federal and State legislations contain a myriad of economic incentives
for mitigating specific hazards to buildings, such as bolting a structure to its foundation. The Robert T. Stafford
Disaster Relief and Emergency Assistance Act (Public Law 93-288), the Alquist-Priolo Special Study Zones Act (California
Public Resources Code, 1974), and the California Seismic Hazards Mapping Act of 1990 all contain provisions for
market incentives and administrative actions to promote public safety and property-loss reduction. As a result,
a variety of market incentives have been implemented. The rules and market incentives associated with these acts
require site-specific engineering study and review in recognized hazardous areas. However, many vulnerable locations
are not well known and are distributed unequally in hazards-prone regions. For example, the Northridge earthquake
occurred on a previously unknown fault, albeit in a region generally known for its earthquake hazards. This mismatch
of information creates a market uncertainty that could affect a hazards-mitigation strategy. USGS work on this
issue investigated risk assessment methods based on scientific data that can be applied to earthquake hazards.
These methods are intended to evaluate the cost-effectiveness of earthquake-hazards mitigation.
The risk-assessment model can be applied to the problem of earthquake earthquake-hazards mitigation choices
using the following steps:
(1) Establish a decision framework by defining a benefit-cost analysis for earthquake-hazards mitigation choices
and measures;
(2) Develop a physical model that incorporates strong ground motions and site characteristics;
(3) Establish a conceptual model for safety incentives that incorporates the rules for making alternative safety
decisions;
(4) Develop a descriptive model that integrates the spatial and temporal structure for earth- sciences and economic
information;
(5) Formalize step (3) with empirical data to produce a prescriptive model that represents what should be done
to maximize the benefits of mitigation; and
(6) Apply a probabilistic model to identify the optimal strategy from the feasible mitigation choices identified
in (5).
A good example of applying economic modeling is evaluating the choices consumers make in preparing for earthquakes.
People can purchase earthquake insurance, carry out personal or community mitigation efforts, do nothing, or combine
several of these activities.
Consumers in an earthquake-prone region are faced with making choices about personal safety that involve such
factors as the probabilities of earthquakes, potential damages, and appropriate mitigation activities. In addition,
consumers need public information about these factors. The economic model combines the probability of a hazard,
the property value at risk, and the cost of various mitigation activities.
In general, the decisions of an educated consumer are based on avoiding losses. Thus, if a consumer is classified
as benefiting from a strategy that reduces losses, there is a net gain in consumer welfare, and the consumer has
an incentive to purchase mitigation measures. Under these conditions, it is clear that public education and information
can result in large economic savings within a hazardous region. In an ideal world, consumers would be informed
by public agencies of the time, location, magnitude, and local site effects of a future earthquake, and would make
rational decisions. However, scientific data about the recurrence of damaging earthquakes and the geographic vulnerability
of specific sites cannot be precisely determined. We have seen that it is very difficult to predict even the location
of damaging earthquakes. Therefore, occurrences of seismic hazards typically are stated in terms of spatial and
temporal probabilities that can be used in decision making.
Earthquake insurance and building codes are accepted measures to reduce damages. Earthquake insurance policies
have seemingly large deductibles and substantial annual premiums. For example, a representative policy will include
a deductible of 10% of insured value and an annual premium of $2 per $1000 of coverage. Earthquake-related building
codes generally are minimum provisions that are necessary for ensuring structural integrity during shaking. However,
such codes commonly do not address the collateral effects of earthquakes (such as landsliding) that temporarily
exacerbate the potential for damage. Mitigation for a specific hazard may involve major construction activity,
such as foundation alteration, retrofitting internal structural support, or other expensive or extraordinary measures.
Thus, for each mitigation choice there is a planned beneficial effect and a known cost to achieve the specified
level of protection.
One of the real successes of earthquake preparedness in southern California is the Los Angeles City program
to retrofit unreinforced masonry buildings (URMs). Since 1982 several thousand of these structures have been repaired,
some in areas that were strongly shaken by the Northridge earthquake. Although it is difficult to quantify the
benefits of retrofitting, the savings in lives and property for the Northridge earthquake alone has more than justified
this ordinance.
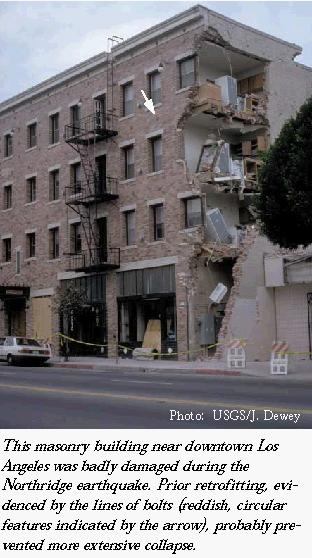
This masonry building near downtown Los Angeles was badly damaged during the Northridge earthquake. Prior
retrofitting, evidenced by the lines of bolts (reddish, circular features indicated by the arrow), probably prevented
more extensive collapse.
|
Lessons Learned
Analyses of the economic impacts of the Northridge earthquake demonstrated
that pre-event mitigation decisions helped avoid significant loss of life and additional property damage. However,
there will be more damaging earthquakes in the future in the region. Economic modeling provides a means for consumers
to evaluate different mitigation choices and incentives. Using a refined model with more complete earth-science
information, consumers can apply economically sound decisions about risk-based regulations or insurance programs
containing incentives for mitigation.
|