| Damage Built Environment | Table of Contents | Geologic Hazards |
Seismic-hazards maps are among the principal connections between research on earthquakes and hazards mitigation. Such maps, produced for the United States since 1976 by the USGS, are the basis for the seismic parts of model building codes such as the Uniform Building Code (UBC). The maps also have wide-ranging applications in a variety of structural-design requirements such as those governing highway bridge design. Insurance companies use the maps to help set rates for individual properties in various areas of the United States. FEMA also uses the maps to help determine allocation of Federal disaster assistance funds to communities damaged during earthquakes.
| Preliminary versions of seismic-hazards maps prepared by the USGS for the
United States can be seen on the World Wide Web at the following address: http://geohazards.cr.usgs.gov As newer maps and related information become available, they will be placed at this WWW site. |
With continuing research, and using the information gained from each new earthquake, seismic-hazards maps are frequently updated. Following the Northridge earthquake, new maps were constructed for the Los Angeles region. These maps are currently (1996) in review and will be revised and produced cooperatively with the California Division of Mines and Geology (CDMG). This effort is supported by FEMA disaster-mitigation funds.
The maps incorporate both the recurrence rate and expected magnitudes of large earthquakes along each fault capable of generating earthquakes. The maps also account for hazards from future earthquake events that could occur, for example, on buried or unmapped faults. The maps show ground motions that have a specified annual probability of being exceededimportant information used for engineering buildings to withstand the ground motions expected over their design lifetimes.
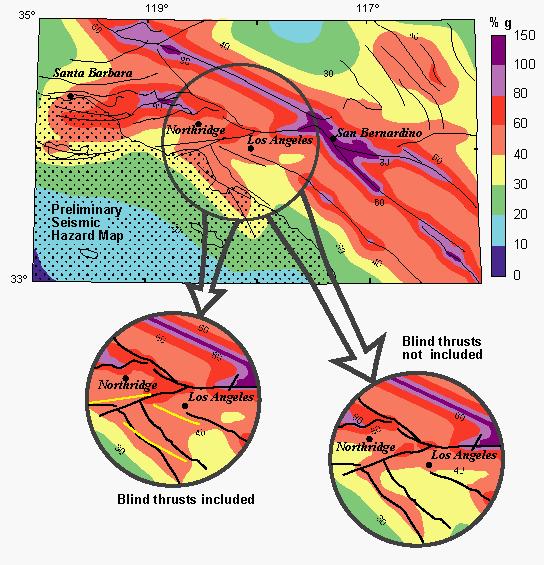
The preliminary map for the Los Angeles region illustrates that seismic hazards are manifestations of (1) strike-slip motion along the San Andreas, San Jacinto, and other faults; and (2) broad, north-south compression caused by the Big Bend in the San Andreas fault east and north of the Los Angeles area. This map shows high seismic hazards throughout most of southern California where probabilistic ground motions during a 50-year period generally exceed 30%g. Many heavily developed areas near Los Angeles have mapped ground motions that exceed 40%g, primarily due to the presence of the Newport-Inglewood and Palos Verdes faults. There are also substantial hazards associated with the confluence of the Sierra Madre and Raymond faults, which accommodate north-south compression (see p.18).
Higher values of hazards (greater than 60%g) occur along the San Andreas, San Jacinto, and Elsinore faults. These strike-slip faults have relatively high slip rates and recurrence times as short as 150 years for certain segments. High hazards occur where faults intersect or are adjacent to each other, because these locations are more likely to experience large ground motions from both of the adjacent faults. The area of highest seismic hazards (with a 10% probability of exceeding 100%g in a 50-year period) is near San Bernardino, which is adjacent to both the San Andreas and San Jacinto faults.
A prominent zone of higher hazards extends from south of Santa Barbara to the northern part of the San Fernando Valley and the bordering mountains. This is caused by a group of thrust faults with relatively high slip rates, exemplified by the Oak Ridge and San Cayetano faults. The new hazards map emphasizes the importance of blind thrust faults (similar to the fault that produced the Northridge earthquake) to the seismic hazards of the Los Angeles region.
This preliminary seismic-hazards map is based on both historical seismicity and recurrence times of fault movements derived from geologic slip rates. The circles show how a section of the map would appear with and without the effects of blind thrusts (yellow lines). Given the uncertain seismic potential of the blind thrusts, scientists modified the preliminary map to account for the uncertainties. This map depicts peak horizontal ground accelerations that have a 10% probability of being exceeded in 50 years.
How the Northridge Earthquake Affects Seismic Hazards Maps
The Northridge earthquake had two primary effects on seismic-hazards maps for California. First, it emphasized the importance of blind thrust faults to seismic hazards. Second, the high accelerations during the quake reinforced previous observations that earthquakes on thrust faults produce higher ground accelerations than those on strike-slip faults.
To evaluate the effects of blind thrust faults, USGS scientists produced two hazards maps for situations with and without four recently identified blind thrust faults. The blind thrusts considered were the Elysian Park thrust, the Compton-Alamitos thrust, the Santa Monica Mountains thrust, and the Santa Barbara Channel thrust (see p. 18). For these faults, they used two recurrence models that are weighted equally in the hazards calculation: (1) a characteristic fault-rupture model where the entire fault ruptures at some average recurrence rate, and (2) another model where there is a range of earthquake magnitudes occurring on each fault, with M = 6.5 events being more frequent than larger events that rupture the entire fault. Each recurrence model was given a weight of 0.5 because of uncertainties about the seismic potential of the thrust faults, and the inferred dips of the thrusts were included when calculating site-source distances.
Including the blind thrust faults raises the probabilistic ground motions (a 10% probability of being exceeded in 50 years) by as much as 15%g for areas near the faults. There are also significant changes in the 40%g contour in the vicinity of the blind thrusts. For example, differences between the maps are seen for the area of central Los Angeles where probabilistic accelerations increase from 38%g to 45%g with inclusion of the blind thrust faults. There were similar increases in the area southwest of Northridge, and for Santa Cruz Island and parts of the Santa Barbara Channel.
The large ground motions recorded for the Northridge earthquake confirm that thrust faults can generate ground motions larger than those of strike-slip faults for earthquakes of similar magnitudes and site-source distances. USGS scientists have found that thrust-fault earthquakes produce peak accelerations near the source that are about 20%g-30%g higher than those of strike-slip earthquakes. These differences are directly reflected in the maps of probabilistic ground motions. As new ground-motion relations that include the Northridge data are developed, the effects of thrust faulting probably will become even more prominent on the maps.
|
Blind thrust faults, such as the one that produced the Northridge earthquake, increase the seismic hazards for the Los Angeles region. The very presence of these additional faults adds to the hazards, and thrust faults also tend to produce stronger ground motions than strike-slip faults. |
Continuing efforts to reduce the threats of earthquakes in an effective and practical way requires knowledge of the levels of hazards in different areas. Future earthquakes are most likely to originate where strain surrounding a fault has built up and has not yet been released in earthquakes. In southern California, for example, scientists estimate that the probability of a magnitude 7 or greater earthquake by the year 2024 is as high as 80%-90%. How the threat from earthquake ground shaking varies across southern California is shown on hazards maps like those described in the previous section, and elsewhere in the report (see p. 25). These hazards maps are derived from decades of work by scientists in government, universities, and private industry. Such work continually refines hazards estimates, incrementally correcting and updating the hazards overview as new information and techniques become available. The following sections offer some insights into the fundamental work that contributes to hazards assessments through reviewing the effects of past earthquakes, modeling what earthquakes might do in the future, and comparing the effects of different earthquakes on the same or similar facilities.
Seismic-hazards evaluation depends upon information about the frequency of occurrence of moderate to large earthquakes that produce damaging ground motions. This information is generally obtained by observing evidence of past earthquake activity in trenches excavated across faults. Earthquake recurrence intervals are also inferred from geological studies that provide slip rates of faults. Following the Northridge earthquake, USGS geologists investigated the frequency and potential size of damaging earthquakes in the San Fernando Valley and environs. The investigations included trenching across known faults and subsurface investigations of linear zones of ground cracks in Potrero Canyon, the Granada Hills-Mission Hills area, and Northridge (see p. 33). Using secondary features such as ground cracks to date earthquake recurrence intervals represents a new method for providing information about past and future ground motions.
| The main goal of trenching studies is to examine closely the disrupted geological deposits in fault zones by exposing cross sections of the zones. Careful mapping of the deposits and the fault traces and other features within them can identify the nature of ruptures from past earthquakes. Organic materials in the deposits, such as charcoal or peat, can be used to date disruptions and produce a history of earthquakes that affected the site. The study of earthquake-related features preserved in the geologic record is called paleoseismology. |
After the 1971 San Fernando earthquake, USGS geologists excavated several trenches across the rupture zone and estimated that a prior event might have occurred about 200 years ago. Following the Northridge earthquake, scientists excavated three new trenches in the area of the 1971 faulting and found new evidence suggesting the prior event was much older than 200 years. The new trench data show a clear 20 centimeters of vertical displacement caused by the 1971 event, plus older deposits with a much larger vertical displacement of about 50 centimeters. Distinctive sands and gravels that can be matched across the fault provide evidence for the two most recent earthquakes that occurred prior to 1971. Charcoal samples from the deposits and the degree of development of buried soils show that the penultimate event is older than 400 years and could be as old as 3,500-4,000 years. The timing for the other event prior to 1971 is currently (1996) being investigated. The evidence compiled to date suggests that only two earthquakes have occurred on this fault segment during the past 3,500-4,000 years, one of them in 1971, indicating a much longer recurrence interval than previously believed.
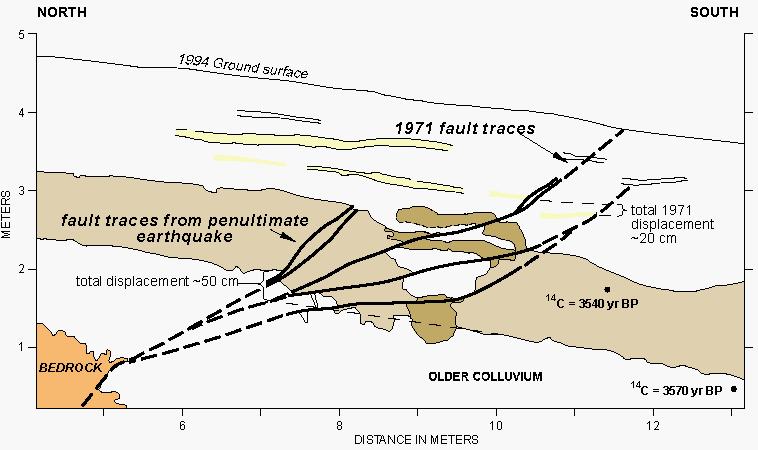
The geological section across the Sierra Madre fault shows features from the 1971 San Fernando earthquake, and the penultimate earthquake that occurred as long as 4,000 years ago. The fault trace of the penultimate earthquake fractured materials (beige, stippled pattern) that were radiocarbon dated at 3,540 years before the present (BP). This fault trace also fractured the underlying deposit that was dated at 3,570 years BP. Since the penultimate earthquake, about 1.5 meters of materials accumulated atop the fractured surface. The 1971 earthquake then fractured both the older deposits and the materials that accumulated above them over the past 3-4 millennia. Geologists also measured displacements at this site of about 50 centimeters for the ancient earthquake and about 20 centimeters for the San Fernando event.
USGS geologists excavated 16 trenches in Potrero Canyon, a 5-kilometer-long valley on the north flank of the Santa Susana Mountains about 22 kilometers north-northwest of the Northridge earthquake epicenter (see p. 33). They found evidence there for two prehistoric earthquakes from buried fissures filled with sediment, displacement of older stratigraphic units relative to younger ones across individual fractures, and fracture traces buried by nonfractured deposits.
In one trench, the sequence of earthquakes was preserved in a series of datable mudflow deposits. The displacement patterns indicate similar effects from two earthquakes, radiocarbon dated at about 1100 A.D. and 900 A.D., and from the 1994 Northridge earthquake. As indicated on p. 41, the Potrero Canyon ground cracks appear to be caused by ground deformation related to shaking rather than primary surface faulting. Therefore, geologists conclude that there were two other earthquakes comparable to the 1994 Northridge event that produced strong ground shaking at Potrero Canyon within the past 1,300 years. These interpretations indicate an average recurrence rate of about one event every 650 years from the first event to the Northridge quake.
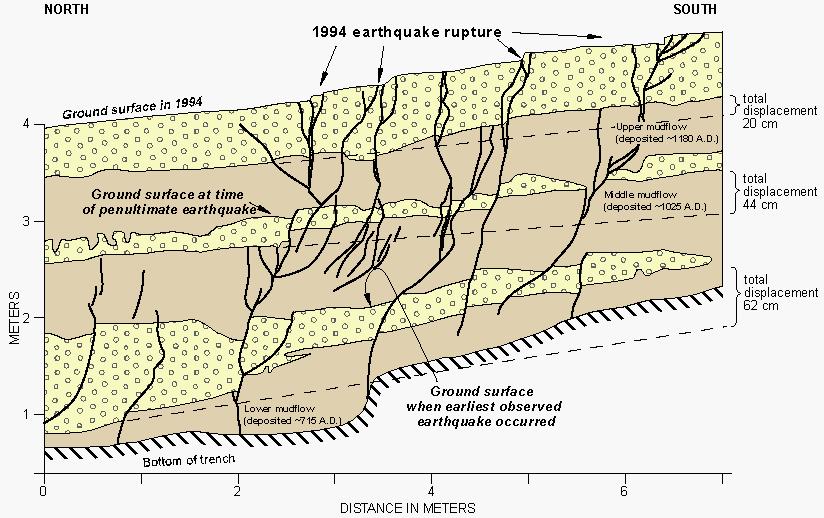
This geological section from a trench in Potrero Canyon shows relations among ground cracks from different earthquakes, offsets of geological units, and the corresponding dates that are used for recurrence estimates. The section contains evidence for ground fractures produced by three earthquakes during the past 1,300 years. The uppermost deposit was displaced about 20 centimeters during the Northridge earthquake, the top of the middle mudflow deposit was displaced about 44 centimeters in two earthquakes, and the top of the lower mudflow deposit was displaced 62 centimeters in three earthquakes. Thus, the three earthquakes produced remarkably similar effects, both in the types of features exposed in the trench and in the net displacement for each event. The fractures are thought to be the result of strong ground shaking, and do not indicate the presence of a seismogenic fault (see p. 41).
The Potrero Canyon trench interpretations appear to indicate recurrences for earthquakes similar to the Northridge event. However, earthquakes on other nearby faults, such as the Santa Susana and Oak Ridge faults (see p. 23), might also have produced the displacements seen in the trenches. In reviewing the 1,300-year geologic record from the trenches, USGS geologists see no evidence of large earthquakes that have occurred every 100-200 years on the San Andreas fault 40 kilometers to the north. Also, no evidence is seen for the 1971 San Fernando earthquake, the epicenter of which was located 25 kilometers southeast of Potrero Canyon. Therefore, it seems unlikely that events on the most active nearby surface faults produced permanent ground deformation at Potrero Canyon. The most reasonable interpretation of the data is that the prehistoric earthquake evidence observed in Potrero Canyon is the result of events on buried thrust faults.
|
Identifying and trenching secondary ground-deformation features potentially provides information on earthquake recurrence intervals. This new approach, in conjunction with additional studies on other surface faults, may be widely applicable in the Los Angeles basin as a basis for estimating the recurrence of damaging ground motion from earthquakes on blind thrust faults. |
A zone of ground cracks in the Granada Hills-Mission Hills area (see p. 33) showed movements in the centimeter to decimeter range. USGS geologists investigated these features by excavating three trenches across prominent areas of tension cracks in the western end of the zone. These cracks appear to be a response to shaking rather than to tectonic faulting. Geological stratigraphy was similar in all three trenches, consisting of debris-flow and stream-channel deposits. None of the trench exposures showed any clear evidence of disruption from earthquakes prior to the 1994 event. Age data from the deposits suggest that in the 600 years prior to 1994, there were no earthquakes large enough to produce ground motions in this zone comparable to the motions produced by the Northridge earthquake. This interpretation is consistent with recurrence data from Potrero Canyon.
and Northridge In the Malden St. area of Northridge (see p.33), ground failure occurred in a zone about 500 meters long. Scientists excavated a trench across one of the principal deformations and found no evidence of disruptions due to earthquakes predating the Northridge event. Age data are not yet available for this site, but material properties and degree of soil development in the deposits are comparable to those seen in the Granada Hills-Mission Hills trenches. This evidence suggests that prior earthquakes large enough to produce deformations at this site have not occurred in the past several hundred years.
|
Impacts similar to those produced by the Northridge event have occurred at Potrero Canyon at two earlier times in the past 1,300 years, implying an average recurrence interval of 650 years for Northridge-type events. These impacts were most likely produced by blind thrust faulting from the nearby network of faults related to the Northridge event. The part of the Sierra Madre fault that broke in the 1971 San Fernando earthquake has had only two similar earthquakes in the past 3,500-4,000 years. The past earthquakes were most likely similar in magnitude to the more recent 1971 and 1994 events, suggesting that M = 6.5-7.0 events are perhaps characteristic of the thrust-fault structures. There is no clear evidence that larger earthquakes have occurred on these fault structures in the past few thousand years. |
Once scientists have estimates about earthquake locations and recurrence, they can develop methods for estimating the levels of shaking the earthquakes will produce. This information is important for engineering design of individual buildings and for site-specific characteristics of ground motions. Following the Northridge earthquake, USGS scientists estimated ground motions (where none had been recorded) throughout a broad region surrounding the Northridge fault-rupture zone. The purpose of this work was to provide realistic, broadband ground motions that represented the range and variability of ground motions from the earthquake. This method can be used to predict ground motions for future earthquakes in the region.
Scientists first determined a fault-rupture model for the earthquake that was consistent with geodetic, leveling, strong-motion, and teleseismic data (see p. 13). Next, they superimposed a grid of target sites surrounding the fault-rupture zone. In this case, they selected a grid of 144 sites over an area of approximately 3,600 square kilometers, with a spacing of about 5 kilometers between sites. Long-period (>1 second) ground motions were computed for each grid site. High-frequency (periods <1 second) ground motions were then chosen from the observed Northridge earthquake recordings to best approximate the correct directivity, site conditions, and epicentral distance for each of the grid sites. Finally, mathematical filters were used to remove the short periods from the computed ground motions, and to remove the long periods from the observed recordings. The two filtered records were summed to produce a final ground-motion simulation for each grid site.
The final product consists of 144 three- component, broadband ground-motion time histories that can be used as input into engineering design and hazards assessment. This product allows for analyzing the damage potential of ground motions over the entire region covered by the grid, rather than relying on the observed recordings alone. The product can be used to simulate the effects of postulated earthquakes on sites throughout the area covered by the grid. Each site on the grid would show synthetic responses to that earthquake, such as ground accelerations, velocities, displacements, durations of shaking, or a range of spectral amplitudes. An investigator could then interpolate between grid points to estimate, for example, alternative engineering-design characteristics of a site. As one example, USGS scientists used the grid to produce a map of peak ground velocities throughout the region of the Northridge earthquake. The results of this analysis are shown on page 13 in their relation to the Northridge earthquake fault-rupture model.
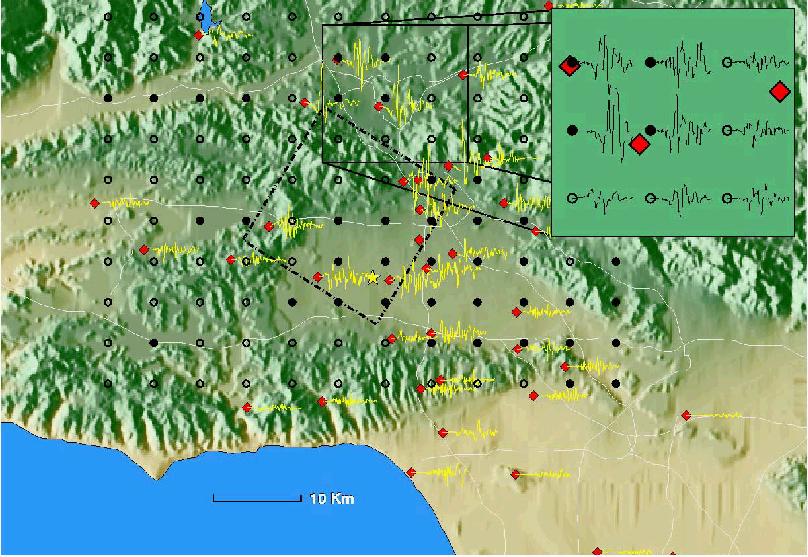
The distribution of strong-motion stations (open diamonds) illustrates the relatively sparse coverage of the region affected by the Northridge earthquake. To extrapolate information throughout the region, USGS scientists developed a method for producing synthetic ground motions for each of 144 points on a regional grid (inset). The grid allows several kinds of information for recorded and postulated earthquakes to be extrapolated throughout the region.
Inset: Using synthetic waveforms, USGS scientists computed ground velocities at these nine grid points. Compare these with the observed recordings at nearby stations.
The final product consists of 144 three-component, broadband ground-motion time histories that can be used as input into engineering design and hazards assessment. This product allows for analyzing the damage potential of ground motions over the entire region covered by the grid, rather than relying on the observed recordings alone. The product can be used to simulate the effects of postulated earthquakes on sites throughout the area covered by the grid. Each site on the grid would show synthetic responses to that earthquake, such as ground accelerations, velocities, displacements, durations of shaking, or a range of spectral amplitudes. An investigator could then interpolate between grid points to estimate, for example, alternative engineering-design characteristics of a site. As one example, USGS scientists used the grid to produce a map of peak ground velocities throughout the region of the Northridge earthquake. The results of this analysis are shown on page __ in their relation to the Northridge earthquake fault-rupture model.
In 1971, the near failure of the Lower San Fernando Dam forced 80,000 people to evacuate their residences. In 1994, the replacement dam survived an almost identical earthquake with little damage. Underlying this progress in designing critical structures are years of research on the powerful shaking during large earthquakes.
Moments after the San Fernando earthquake, only a thin dirt wall stood between 80,000 people in the San Fernando Valley and 15 million tons of water poised behind a heavily damaged dam. The 47-meter-high dam was perilously close to failure, and at any moment a strong aftershock could have triggered a disaster. Residents in a 30-square-kilometer area were forced to evacuate while the water level behind the earthen dam was lowered, a process that took 3 days.
The dam was so heavily damaged during the earthquake that it could not be repaired to safely hold its water supply during another large earthquake. A replacement dam was neededone designed to withstand strong ground shaking associated with earthquakes expected in the area. In studying records of strong shaking from the 1971 shock and other shocks, USGS scientists realized that shaking near the epicenter of an earthquake is much stronger than had been recognized prior to 1971. Hence, they recommended the new dam be designed to withstand shaking about three times stronger than that assumed in earlier design studies. The recommendations were met with skepticism at first, because critical structures were being designed for lower levels of shaking at that time. Inasmuch as the new dam was to be financed with Federal disaster assistance funds, the higher estimates of shaking were used in its design.
The new 33 million-dollar Los Angeles Dam and Reservoir, located about 1 kilometer up the valley from the old Lower San Fernando Dam, was built in 1975-76. However, the Lower San Fernando Dam was not dismantled. Instead, it was reconstructed -- though not to meet the USGS shaking estimates -- to provide a holding basin for storm water and to back up the new dam.
Two decades later, the 1994 Northridge earthquake put the Los Angeles Dam to the test. The Northridge earthquake was approximately equal in magnitude to the San Fernando event. Ground shaking was very strong, with amplitudes among the highest ever recorded but consistent with the USGS estimates. Yet the dam showed only minor deformation and superficial cracking. Despite the intense shaking, the crest of the dam moved only 2.5 centimeters sideways and settled only 9 centimeters. In contrast, the Lower San Fernando Dam again suffered heavy damage. Had the old dam been holding as much water as it had in 1971, the damage would have been far greaterat least equaling that from the 1971 earthquake.
The new 33 million-dollar Los Angeles Dam and Reservoir, located about 1 kilometer up the valley from the old Lower San Fernando Dam, was built in 1975-76. However, the Lower San Fernando Dam was not dismantled. Instead, it was reconstructedthough not to meet the USGS shaking estimatesto provide a holding basin for storm water and to back up the new dam.
This success story focuses on dams. However, other critical structuressuch as nuclear powerplants, bridges, and hospitalsare being built more strongly today to resist the violent shaking that is now recognized to accompany large earthquakes.
| Communicating | Table of Contents | Geologic Hazards | TOP |
| AccessibilityFOIAPrivacyPolicies and Notices | |
| |
|
