
TIME-SERIES PHOTOGRAPHS OF THE SEA FLOOR IN
WESTERN MASSACHUSETTS BAY; June - October 1996
Bradford Butman1, John Evans1, William N. Lange2, and Chris Polloni1
1U.S. Geologic Survey, Woods Hole, Massachusetts
2Woods Hole Oceanographic Institution, Woods Hole, Massachusetts
U.S. Geological Survey Open-File Report 98-797
November 1998
Time-series photographs of the seafloor were obtained at a site in western Massachusetts Bay (42o 22.6' N 70o 47.1' W) between June 11, 1996 and October 1, 1996 at water depth of 31 m. The long-term monitoring station is just to the south of the location of the new ocean outfall that will begin discharging treated effluent in 1999 (see plan view map and perspective map). The photographs are part of a suite of observations obtained by the U.S. Geological Survey (Bothner et al, 1994) and others (Geyer et al, 1992), to monitor sediment resuspension and transport in Massachusetts Bay. The observations are made in cooperation with the Massachusetts Water Resources Authority. This deployment is USGS mooring number 470.
Several hundred similar sequences of bottom photographs have been obtained at a wide variety of locations on the United States continental margin since 1975. This is a pilot project to develop a mechanism to digitally view, archive, and distribute the time series bottom photographs.
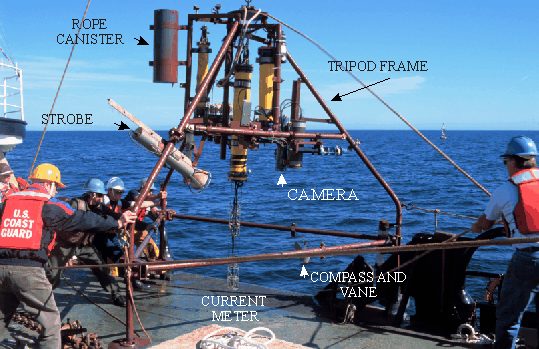
The bottom photographs shown in this Apple Quicktime time-series movie (~30Mb) were obtained by means of a 35 mm Benthos camera mounted approximately 2 m above bottom on a tripod frame (photo). The pictures were obtained nominally every four hours(3 hours 59 mins in this deployment). The field of view is approximately 1 m by 1.5 m. True north is to the top of the screen. A compass and vane mounted on a swivel, showing the orientation of the tripod and instantaneous direction of flow, are partially visible in the photos (the vane is often out of the field of view, and the glare of the strobe on the glass dome housing the compass limits the time that the magnetic north arrow is visible).
In addition to bottom photographs, instruments on the tripod measured current, temperature, light transmission, pressure, and conductivity. These provide direct measurements of the processes causing sediment resuspension and transport. The tripod also supports a sediment trap that collects sediments suspended in the water column.

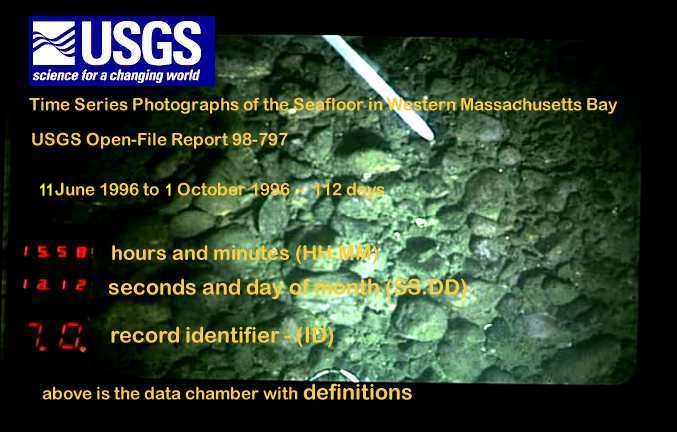
The Benthos camera places the images on a 100-foot roll of 35 mm film in a non-standard format. The images are placed along the long-axis of the film (this allows a larger image size of the bottom than if the image were placed across the film in a standard 35 mm format). The film is advanced using an O-ring drive; the loose drive and drive-motor inertia results in the distance between frames varying slightly with each image. A light emitting diode (LED) data display, showing a record number and the day, hour, minute and second of the photo, is placed on each image. The LED clock is a 31-day clock and counts without regard to month of year (the Benthos camera was originally designed for obtaining photographs from ships over a period of a few hours and thus the LED day could be reset as necessary). Used in a time-series mode, the 31-day clock results in a day number on the film that does not always correspond to the day of the month for deployments that include months with other than 31 days. For this film, the clock day was set in the lab to day 6 on June 5; thus clock days in June are one day ahead of the true day (the last day in June (the 30th) is day 31 on the LED clock). Clock days in July, August, and September correspond to the true month day. A table showing image number, time, and LED clock time is provided for navigating the jpeg images.
To register each image, the film was scanned and digitized using a scanner developed by the Woods Hole Oceanographic Institution. The digitizing system adjusts the gain for low light levels, so the light levels between images are not directly comparable. Especially during times of sediment resuspension, the digitized images appear bright, where in fact, the light levels are extremely low due to the high level of suspended sediments. The imagery from this process was archived as tif images and as an mpeg time-series movie.
The digitized images were registered using a MATLAB routine that searched the image for the data chamber (that is placed in the same position on each frame) and adjusted the image position accordingly. This procedure removed most of the ‘jitter’ resulting from the varying distance between frames when the images are shown in a time-series mode. The resultant imagery was combined with ancillary information to produce the Apple quicktime movie.


The Apple Quicktime movie displays a cropped version of the bottom images (the data chamber time and date, as well as the perimeter of the image which was underexposed, are not shown). Along the bottom of the photographs is additional data collected by sensors mounted on the bottom tripod. Beam attenuation (show in yellow) is a measure of suspended sediment concentration and the standard deviation of the bottom pressure (shown in green) is a measure of the currents caused by surface waves. The arrow on the left is the low-passed current. This arrow points in the direction of the net flow and the direction of transport of water and sediment when the tidal currents are averaged out. We have included the Apple Quicktime movie, an mpeg movie (the precropped version that has the data chamber time and date and includes underexposed perimeter), a set of still-frame tif images, a collection of movie player software for a variety of computer platforms and an indexed set of thumbnails of the 675 still-frame images linked to full size jpegs. The jpeg imagery was extracted from the mpeg movie using Silicon Graphics workstation mediaconverter(Silicon Graphics Inc., 1997). The resolution of these images does not match the quality of the 35mm film.
Highlights of bottom processes
The time series movie shows changes in the sea floor. A major process illustrated in these photographs is the resuspension of sediments caused by currents associated with waves. Note the episodic increases in suspended material which occur during times of large pressure standard deviation and that obscure the bottom from view (for example on September 3 and September 18). The sea floor in this region of Massachusetts Bay is gravel and coarse sand. However, there are patches of fine-grained sediment nearby, and a fine veneer of fine sediments accumulates on the sea floor during non-storm times. These fine sediments are resuspended by the strong oscillatory currents associated with surface waves. In some of the events, a small rock or boulder shifts position on the sea floor. For example, a cobble located about 1/3 of the way from the west (left) edge of the frame (approximately in line with the compass housing) shifts from east to west (right to left) on July 24. Throughout the period, small shells can be observed moving in the field of view. These changes can be most easily observed by using the slider on the viewing bar to quickly view the sea floor at different times. Other observations and modeling suggest that fine sediment resuspend during storms in this region of western Massachusetts Bay is transported to the south toward Cape Cod Bay, and offshore into Stellwagen Basin (Butman and Bothner, 1998). These regions are the long-term depositional sites in the Massachusetts Bay region.
List of Deployment times and actions
(1) Camera clock set on June 05, 1996 at 08:42 EST; set to day 06 08:42
(2) Tripod deployed on June 11, 1996 at 11:19 EST
(3) First bottom photograph June 11, 1996 at 11:58 EST
(4) Tripod recovered on October 2, 1996
(5) Camera clocks check October 7, 1996 at 09:20 EST; reads day 06 09:18
Bill Strahle and Marinna Martini prepared and deployed the bottom tripod system. Fran Hotchkiss processed and edited the time-series data. Mike Bothner was chief scientist on the USCG Buoy Tender WHITEHEATH cruises that deployed and recovered the instrumentation. The long-term observations are supported by the U.S. Geological Survey and the Massachusetts Water Resources Authority, with logistical support from the U.S. Coast Guard.
Butman, B. and Bothner, M.H., 1998, Predicting the long-term fate of sediments and contaminants in Massachusetts Bay, USGS Fact Sheet, 172-97.
Bothner, M.H., Bucholtz ten-Brink, M., Butman, B., Knebel, H.J., Manheim, F.T., and Signell, R.P., 1994, Circulation and contamination transport in Massachusetts Coastal waters: A summary of achievements and future plans, U.S. Geological Survey Open-file Report, 94-649, 43 p.
Geyer, W., Gardner, G., Brown, W., Irish, J., Butman, B., Loder, T., and Signell, R., 1992, Physical Oceanographic Investigation of Massachusetts and Cape Cod Bays, Technical Report MBP-92-03, Massachusetts Bays Program, U.S. EPA Region I/Massachusetts Coastal Zone Management Office, Boston, Massachusetts, 497 pp.
Silicon Graphics, Inc., 1997, Digital Media tools; MediaConvert, SoundTrack, and MovieMaker, digital media tools.
[an error occurred while processing this directive]