| Environmental Geochemistry and
Sediment Quality in Lake Pontchartrain |
III. Data and Preliminary Interpretations (con't)
C. Inorganic Chemistry
Figure 17. Zinc
|
Figure 18. Copper
|
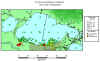
Figure 19. Lead
|

Figure 20. Cadmium
|
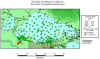
Figure 21. Chromium
|
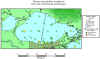
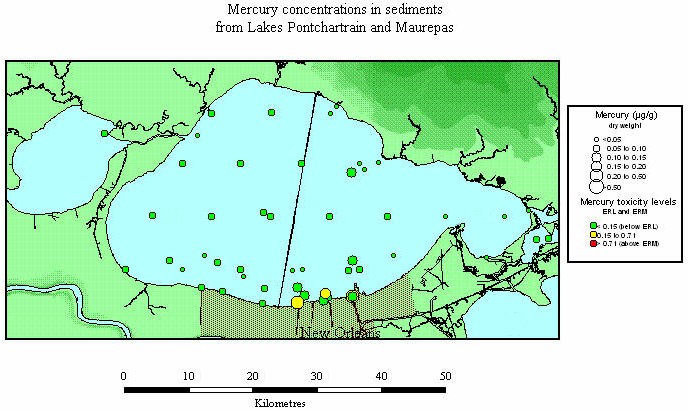
Figure 22. Mercury
|
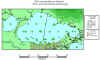
Figure 23. Silver
|
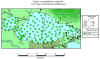
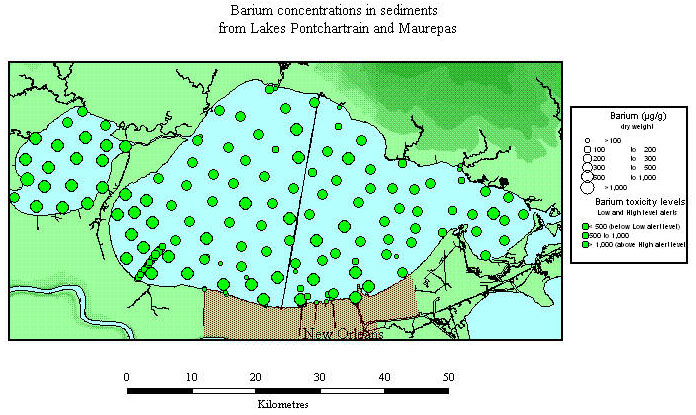
Figure 24. Barium
|
Eight metals from among the many inorganic constituents reported in the major chemical
table (Appendix 4), are plotted in figures 17 to 24. These are displayed in two ways. The
size of the dots is proportional to their concentration, as shown in the legends. At the
same time samples whose metal concentration exceeds screening
guidelines for potential sediment toxicity to bottom organisms are plotted in yellow
and red. It may be readily noted that the majority of yellow and red-indicated samples
occur in coastal areas near the New Orleans urban area, or in inland waterways, especially
Bayou Trepagnier. The Bayou is the locus of former waste discharge by a petrochemical
complex (LDEQ, 1989). The inlet’s water now discharges into the Mississippi River
rather than Lake Pontchartrain. Surficial samples near the inlet have not to date
registered significant influence on Lake Pontchartrain sediments (Sarkar, 1995).
As explained, the specific analytical method affects the apparent distribution of
certain constituents. Chromium (Fig. 21) in particular
is present in relatively high concentrations in naturally-occurring (pristine) clays. The
irregular sprinkling of low-level "toxicities" for this element are more likely
the product of natural distributions than pollutant-related. The apparent
"triggering" of warnings of low-level toxicity levels has been previously noted
in scientific studies in other parts of the country, where Cr is analyzed by total
dissolution methods. In like fashion, though, some of the anomalies occur logically at the
mouth of canals and other waterways known to have discharged significant contaminated
wastes. A few isolated datapoints will be reviewed in future studies and may not
necessarily signify real enhanced contaminant deposits. In all cases isolated anomalies
need to be viewed with caution.
|