
| Environmental
Geochemistry and Sediment Quality in Lake Pontchartrain |
Satellite Imagery:
Lake Pontchartrain Basin and Gulf of Mexico
Richard P. Stumpf
[Editors note: The text to this chapter was modified from the CD-ROM publication
"Satellite Imagery of the North-Central Gulf of Mexico" (Stumpf, 1998) and the
web site http://coastal.er.usgs.gov/pontchartrain/IMAGERY/.
The author has left USGS for a new position at the NOAA Climatic Data Center (Satellite
Data Services Division). For more detailed background, see references at the end of this
chapter, especially Stumpf, 1998.]
Introduction
Methods and Technical Information
Applications to the Bonnet Carré Spillway Opening
North-Central Gulf of Mexico Imagery
Lake Pontchartrain Basin Imagery
Data Sources and References
Introduction
The studies reported here refer to satellite imagery collected by the NOAA Advanced
Very High Resolution Radiometer (AVHRR) on NOAA polar-orbiting weather satellites. AVHRR
provides nearly daily coverage of a site at resolutions of approximately 1 km.
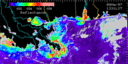
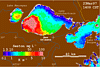
Two scales of imagery are provided: data covering the region of the Gulf of Mexico from
the Florida Panhandle to Louisiana (from Stumpf, 1998), and expanded images of the Lake
Pontchartrain area (obtained from website referenced above). Links to the imagery are
located at the bottom of this page.
The data sets include measurements of sea surface temperature (SST), water reflectance,
and false-color infrared imagery. The water reflectance measurements have been converted
to provisional estimates of suspended sediment concentration (seston) and diffuse
attenuation coefficient (K) based on algorithms developed for the area.
Methods and technical information
Satellite systems. The imagery was produced from data collected by the AVHRR on the
NOAA polar-orbiting environmental satellites. NOAA-14 was the primary satellite used for
this set of images with an overpass time of 1400 local standard time (LST). The data sets
were acquired from the Louisiana State University Earth Scan Laboratory and the University
of South Florida/Florida Department of Environmental Protection Joint Use Facility. The
satellites carry several sensors for meteorological studies. More details on the AVHRR and
the satellites can be found in Kidwell (1991).
The NOAA polar-orbiters are in a sun-synchronous orbit, meaning that they will pass
over a point at about the same time each day. The satellite has a nominal elevation of
about 830 km and takes about 100 minutes to complete an orbit. The nadir point shifts
about 3 degrees of longitude each day. About every 9 days, an area of interest is at
nadir, centered in the satellite view area. Because of the movement in nadir position,
during any nine-day period an area is within the scanned region for 6 days.
AVHRR is a multiple-band scanning radiometer. The instrument scans one line at a
time, with the movement of the satellite producing an offset between lines, resulting in
the development of an image. The instantaneous field of view (IFOV) is 1.4 milliradians,
corresponding to a ground resolution of 1.1 km at the nadir point. Because of along-scan
overlap of the pixels, the nadir pixel area is nominally 0.8 km by 1.1 km. The instrument
scans 2048 pixels per line to a maximum scan angle from vertical of 55 degrees, covering a
distance on the ground of about 2500 km. Because of the extreme angle at the ends of the
scanlines, geometric and atmospheric distortion become substantial for areas imaged at the
limits of the scanlines. Scenes that fell at the edges of the satellite viewing area were
generally not used because of the poor image quality.
The AVHRR has 5 channels on the current satellites, 2 reflected light, and three
thermal-infrared. The two reflected light channels (580-680 nm and 720-1000 nm) are used
to derive water reflectance images for this study. These channels are used for a variety
of purposes not addressed here, including mapping of vegetation, snow, ice, and clouds.
The thermal infrared images are used to derive the sea surface temperature imagery.
Baseline data. The World DataBank 2 was used for overlays to these images. This
database includes coastlines, state boundaries, and major rivers. A land mask was derived
from the database shoreline.
Images. The false-color infrared imagery provides a photographic view of the
area, allowing the user to identify cloud patterns, land features, and other patterns such
as glint off the water. These images correspond approximately to color-infrared film.
Bright red areas on land represent a dense, vegetated canopy. White areas indicate
cleared, bare fields or urban areas. In the water, river plumes may appear as turquoise,
and glint tends to have a whitish appearance. All other images have a color table
included. Purple corresponds to low values (low temperature or reflectance), red and pink
to the highest values. Identified clouds are masked in gray or pink; land is masked in
black or brown; the coastline is in white; political boundaries are in yellow, and rivers
are in turquoise.
Applications to the Bonnet Carré Spillway opening
The Bonnet Carré Spillway was opened from March 17, 1997 to April 18, 1997 to allow
excess water from the Mississippi River to flow into Lake Pontchartrain, thus lowering the
river stage and decreasing the possibility of flooding. (Baird, 1998, in Lopez, this
publication). To illustrate the effects on the lake, remote sensing data of the Lake and
surrounding Gulf is shown here for March, April and May of 1997, as well as for the same
months during 1996 for comparison. 1995 and 1997 images showing Lakes Pontchartrain,
Maurepas and Borgne are also included to allow closer inspection of the changes. Presented
in this second set are algal bloom images from June and July of 1997, as well.
A plankton bloom built up throughout May, reaching a peak in mid-June (Dortch, 1998, in
Lopez, this publication). Inorganic suspended matter tends to create high reflectivity,
whereas plankton blooms have lower reflectance and may even be absorptive. The
high-reflectance patterns observed from late March through April 18 may reflect
particulate loadings from Spillway discharge, modified by wind-driven current patterns
(Signell and others, this publication). In contrast, the period after April 18 shows
variable reflectance. This is particularly true for late May, when the blooms reached
their greatest extent. More detailed comparisons between surface water physical, chemical
and biological observations may be required to resolve the significance of the patterns.
 North-Central Gulf of Mexico Imagery North-Central Gulf of Mexico Imagery
 Lake Pontchartrain Basin Imagery Lake Pontchartrain Basin Imagery
 Data Sources and
References Data Sources and
References
|