|
|
|
| Introduction | |
| Methods | |
| Distribution of Surficial Sediments | |
| Acknowledgments | |
| References | |
| Figure Captions | |
| Digital Data and Metadata | |
| Back to Table of Contents | |
|
|
|

Chapter 4
|
|
|
| Introduction | |
| Methods | |
| Distribution of Surficial Sediments | |
| Acknowledgments | |
| References | |
| Figure Captions | |
| Digital Data and Metadata | |
| Back to Table of Contents | |
|
|
|
The present distribution of surficial sediment in Long Island Sound
is shaped from the deposits left by the last glaciation and reflects the
cumulative effects of sediment erosion, transport, sorting, and deposition
by tidal and, to a lesser degree, other bottom currents during and since
the Holocene eustatic rise in sea level (Lewis and Stone, 1991; Knebel
and others, 1999; Knebel and Poppe, in press; Poppe and others, in press;
Knebel and others, this CD-ROM). In this paper, we present and describe
a detailed digital map of the regional surficial-sediment distribution
and discuss some of the bottom processes which control this distribution.
 Surficial
sediments (0-2 cm below the sediment-water interface) were sampled and
(or) photographed at 1643 locations (Fig.
1) within the study area between June 1992 and March 1998 aboard
the research vessels Asterias,
John
Dempsey, and Seaward
Explorer using a Van Veen
grab sampler equipped with video- and still-camera systems (Poppe
and others, this CD-ROM). The photographic images were used to appraise
bottom variability, infer small-scale sedimentary processes, and to observe
boulder fields and bedrock outcrops where samples could not be collected.
A total of 1,554 samples for grain-size analysis were placed in sealed
containers aboard ship and frozen for later analysis.
Surficial
sediments (0-2 cm below the sediment-water interface) were sampled and
(or) photographed at 1643 locations (Fig.
1) within the study area between June 1992 and March 1998 aboard
the research vessels Asterias,
John
Dempsey, and Seaward
Explorer using a Van Veen
grab sampler equipped with video- and still-camera systems (Poppe
and others, this CD-ROM). The photographic images were used to appraise
bottom variability, infer small-scale sedimentary processes, and to observe
boulder fields and bedrock outcrops where samples could not be collected.
A total of 1,554 samples for grain-size analysis were placed in sealed
containers aboard ship and frozen for later analysis.
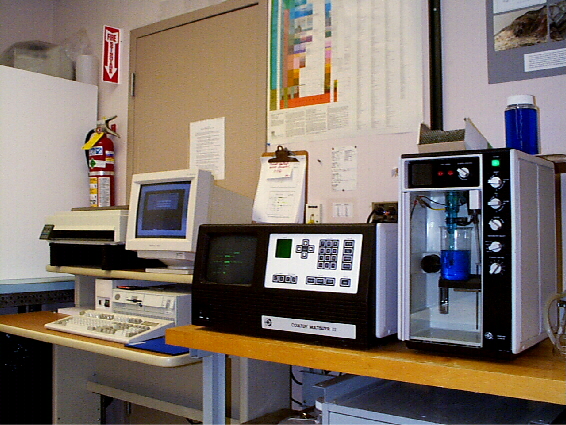
In the laboratory, samples for grain-size analysis were disaggregated and wet sieved to separate the coarse and fine fractions. The fine fraction (less than 62 µm) was analyzed by Coulter Counter (McCave and Syvitski, 1991); the coarse fraction was analyzed by sieving and a rapid sediment analyzer (Schlee, 1966). Bivalve shells and other biogenic carbonate debris were manually removed from the gravel fraction before analysis. Size classifications were based on the nomenclature proposed by Wentworth (1929), the inclusive graphics statistical method (Folk, 1974), and the system proposed by Shepard (1954). A detailed discussion of the computer processing employed on the raw textural data are given in Poppe and others (1998a); the computer software used to extrapolate the grain-size distributions to the colloidal-clay boundary (0.1 µm) to account for material not detected by the Coulter Counter (<0.6 µm) are given in Poppe and Eliason (1999). All textural data were salt corrected.
The grain-size data from this project were combined with over 12,900
published textural analyses and descriptions (Fig.
1; Poppe and others, 1998a), along with information from previous
studies which did not provide basic data or sample locations (e.g. Ellis,
1962), to produce the map and interpretations presented herein. Bathymetry,
backscatter data from continuous and regional sidescan-sonar surveys (Fig.
2; Poppe and others,  1997,
1998b, c, d, 1999a, b), and bottom photographic data (Poppe and others,
this CD-ROM) were used to extrapolate between stations. Units on
the sediment map represent predominant textures; small-scale heterogeneity
within the units and individual polygons is common. All contacts
are inferred because the transitions between the various lithologies are
gradational and lateral changes in texture are seldom abrupt. The
preliminary map was manually contoured on paper and photographed.
The resultant negative was scanned to create a .tif image file that was
brought into ArcInfo. This image file was georeferenced using a projected
tic coverage and the "register" and "rectify" commands. Conversion
of the georeferenced image to a grid was performed to generate a Universal
Transverse Mercator (UTM) projection. Digitizing of the textural contours
was performed on-screen in ArcView. This vector file was merged with a
coastline file to form a polygon shapefile and the polygons were tagged
with the sediment classes as attributes. This shapefile was converted
to an ARCInfo coverage using the "shapearc", "clean", and "regionpoly"
commands.
1997,
1998b, c, d, 1999a, b), and bottom photographic data (Poppe and others,
this CD-ROM) were used to extrapolate between stations. Units on
the sediment map represent predominant textures; small-scale heterogeneity
within the units and individual polygons is common. All contacts
are inferred because the transitions between the various lithologies are
gradational and lateral changes in texture are seldom abrupt. The
preliminary map was manually contoured on paper and photographed.
The resultant negative was scanned to create a .tif image file that was
brought into ArcInfo. This image file was georeferenced using a projected
tic coverage and the "register" and "rectify" commands. Conversion
of the georeferenced image to a grid was performed to generate a Universal
Transverse Mercator (UTM) projection. Digitizing of the textural contours
was performed on-screen in ArcView. This vector file was merged with a
coastline file to form a polygon shapefile and the polygons were tagged
with the sediment classes as attributes. This shapefile was converted
to an ARCInfo coverage using the "shapearc", "clean", and "regionpoly"
commands.
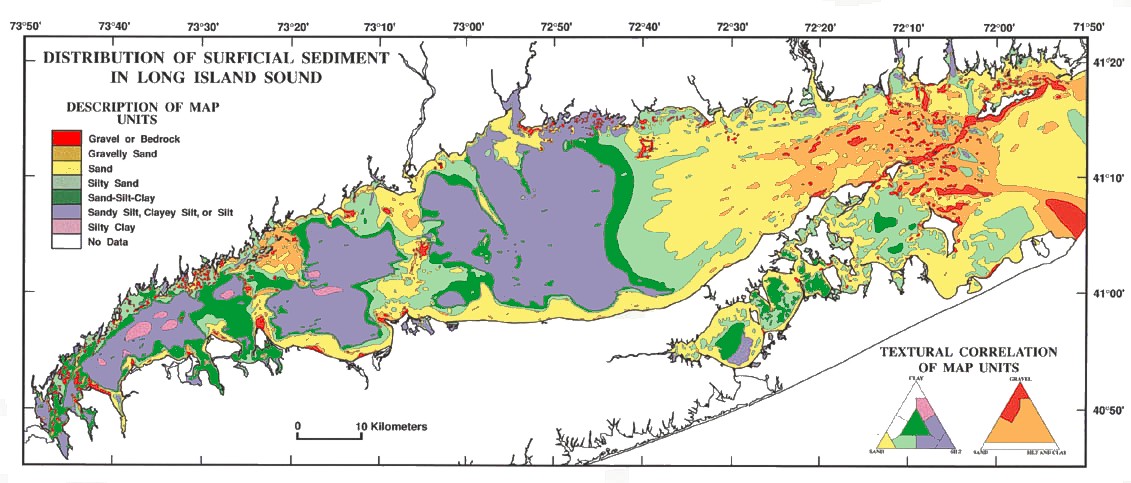 The
map showing the regional distribution of surficial sediments in Long Island
Sound is presented in Figure 3.
To open a georeferenced display of this theme in ESRI's ArcView program
make sure the application is loaded on your computer. Users should
go to the lisound directory located on the top level of this
CD-ROM and double click on the lisound.apr project file.
The individual ArcView shapefiles may also be opened directly with any
Arc application (e.g. ArcInfo, ArcExplorer) and can also be found on the
data
page. Further detailed information can be found on the ArcView
Project Filepage.
The
map showing the regional distribution of surficial sediments in Long Island
Sound is presented in Figure 3.
To open a georeferenced display of this theme in ESRI's ArcView program
make sure the application is loaded on your computer. Users should
go to the lisound directory located on the top level of this
CD-ROM and double click on the lisound.apr project file.
The individual ArcView shapefiles may also be opened directly with any
Arc application (e.g. ArcInfo, ArcExplorer) and can also be found on the
data
page. Further detailed information can be found on the ArcView
Project Filepage.
The regional textural map is extremely patchy. In general, sediment types are most heterogeneous in bathymetrically complex areas, such as where the subsurface geology crops out on the sea floor, and shallow areas, where the bottom currents are highly variable (Signell and others, 1998; Knebel and others, 1999; Knebel and Poppe, in press; Poppe and others, in press). These areas include the easternmost part of the Sound, the Stratford and Norwalk shoal complexes, and the nearshore margins. Moreover, along the central axis of the Sound, the grain size progressively decreases from gravel prevalent near the Race to clayey silt on the flat floor of the central basin. This progression reflects the general east-to-west succession of sedimentary environments (from erosion to transport to sorting to deposition) caused by the decreasing gradient of tidal-current speeds coupled with the net westward estuarine bottom drift (Knebel and others, 1999; Knebel and Poppe, in press).
Gravel and gravelly sand dominate the surficial sediment texture in easternmost Long Island Sound where tidal currents are strong (Signell and others, 1998; Knebel and others, 1999), and in areas characterized by glacial tills, such as around Falkner Island (Poppe and others, 1999a), over the Stratford and Norwalk shoal complexes (Twichell and others, 1997, 1998), along the central axis of Fishers Island Sound (Poppe and others, 1998c), and over the submerged extensions of the morainal deposits along the Connecticut shore (Friedrich and others, 1986; Poppe and others, 1994, 1997). This gravel is a lag left after removal of fines from the till. Gravelly sediments are also prevalent at other places along the nearshore margins where bottom currents are strong enough to winnow finer fractions, especially over bathymetric knolls and in areas directly offshore from promontories. Examination of the grab samples revealed that the gravelly sediments often form thin surficial layers, which are underlain by finer-grained sediments. As such, the lag deposits of gravel armor the bottom.
The size distributions of these gravelly sediments tend to be poorly sorted and bimodal because: (1) the sediments are derived from till, which by definition is poorly sorted; (2) the grab sampler penetrated the lag deposits described above, collecting both the gravel armor and the underlying sediment; and (3) seaweed-encrusted coarse gravel was commonly observed being "rafted" by currents during bottom photography. When the seaweed dies, the gravel is stranded in finer-grained, hydraulically-unequivalent sediment. A thin (<2 cm), possibly seasonal, layer of fine-grained detritus covers boulders and bedrock in the central and western parts of the Sound. The thinness of this veneer suggests that it is aperiodically removed by storm-generated currents.
The irregular bedrock surface crops out locally on the sea floor just off the Connecticut coastline. Examples of prominent outcrops include Madison Reef (Poppe and others, 1997), the inner Norwalk Islands, and off Black Point (Poppe and others, 1998b; Fig. 2); outcrops are especially common southeast of Branford and along the shore west of the Norwalk shoal complex. Individual outcrops typically have north-south orientations that mirror onshore topographic trends. Although common, these outcrops are not depicted separately from gravel on the textural map because they are typically encrusted by mussels, or strewn with glacial erratics and, therefore, could not be differentiated.
Yellow, quartzose sand is the dominant sediment across the east-central Sound, along most of the nearshore margins, on the flanks of the Stratford and Norwalk shoal complexes, and in western Block Island Sound. The most striking sand deposit occurs in the western part of the eastern basin, overlying the uneroded remnant of the -40-m postglacial marine delta (Lewis and DiGiacomo-Cohen, in press). In this region, tidal currents have shaped the sea floor into a series of ridges and channels which contain sand waves (on the ridges) and sand ribbons (in the channels) (Fenster and others, 1990; Knebel and others, 1999; Knebel and Poppe, in press; Poppe and others, in press). The sand, which is typically medium-to-fine grained and moderately well sorted, is generally finer grained on the ridges and sand-wave crests and coarser grained in the tidal channels and sand-wave troughs. Sorting and grain size of the sand decrease westward and toward the southern edge of the basin floor within this region.
Other conspicuous accumulations of sand include Long Sand Shoal and the headland-associated shoals along the northeastern shore of Long Island, such as those off Herod and Roanoke Points (Fig. 2). Sediments presently maintaining Long Sand Shoal are scoured from the surrounding sea floor and driven obliquely up the flanks of the shoal by tidal currents (Haskell, 1977; Signell and others, 1998; Knebel and others, 1999). Along the northern shore of Long Island, on the other hand, bottom circulation and prevailing winds combine to produce a strong eastward littoral drift (Bokuniewicz and Tanski, 1983). Sediments eroded from the bluffs in this area are transported along the coast to headlands where most are deflected offshore and accumulate in shoreface-attached arcuate shoals, such as at Roanoke Point (Poppe and others, 1999b).
The sand along the nearshore margins of the eastern and central Sound is ubiquitously rippled, and generally is unimodal, medium-grained, and moderately well sorted. Sorting and grain size of the sand typically decrease with increasing water depth and distance from shore, except in more protected nearshore areas, such as east of New Haven and shoreward of Falkner Island and the Norwalk Islands. Also, with increasing distance from shore, the margin sands become more finely skewed, olive green, and less quartzose. Similar characteristics were found for the sand associated with the Stratford and Norwalk shoal complexes, and within Gardiners Bay and the Peconic Bays. Relatively little sand is present along the Connecticut shoreline west of the Norwalk shoal complex.
Silty sand and sand-silt-clay mark transitions within the Sound from higher to lower energy environments (Knebel and others, 1999; Knebel and Poppe, in press; Poppe and others, in press). These sediment types are found: (1) on the sides of the central and western basins; (2) on the flanks of bathymetric highs; (3) in the lee of coastal headlands; and (4) in shallow depressions on the nearshore margins. They are also prevalent along the irregular northern shoreline west of the Norwalk Islands and in Huntington, Oyster, Gardiners, and the Peconic Bays. The locations of these sediment types (relative to the coarser and finer sediments) suggest that bottom currents in these areas have a limited ability to sort and winnow the bottom. The silty sands are typically finely skewed, whereas the sand-silt-clay deposits are mainly symmetrical to coarsely skewed.
Dark olive-gray, siliciclastic clayey silt is the dominant sediment type in areas characterized by depositional environments (Knebel and others, 1999; Knebel and Poppe, in press; Poppe and others, in press). Clayey silt is prevalent: (1) over most of the flat sea floor in the western basin and western part of the central basin; (2) in protected nearshore areas, such as the Thames River Estuary, Little Neck Bay, the southern half of Great Peconic Bay, and Branford and New Haven Harbors; and (3) in isolated depressions, such as at the eastern mouth of the channel between the shoals south of Stratford Point and the Stratford Shoal complex (Twichell and others, 1998). These fine-grained sediments are predominantly very poorly sorted (S.D. >2.0) and unimodal. In general, the silt in the westernmost basin is finer than in the central basin, and the silt in the central basin fines southward. Small patches of clayey silt and silty sand found adjacent to Long Sand Shoal and the Race occur in scour depressions where older fine-grained glaciolacustrine and deltaic sediments have been exposed by erosion (Haskell, 1977).
The distribution of silty clay is limited to relatively small patches in the western basin. This sediment type, which has accumulated in deeper water surrounded by clayey silt, is found in low-energy environments protected by bathymetric highs, such as areas on either side of the Norwalk shoal complex. The silty clay is predominantly poorly sorted, coarsely skewed, and unimodal.
Although the deeper (>20 m) waters of the central and western Sound are primarily long-term depositional areas characterized by relatively weak bottom-current regimes, videocamera observations reveal that benthic biologic activity can remobilize muddy sediments on the basin floors. Our data also reveal the localized presence of erosional bedforms, sedimentary furrows and longitudinal ripples, in the silt and clayey silt of the central basin. Although the furrows are probably only intermittently active, they are indicative of a process by which fine-grained sediment can be remobilized and made available for transport elsewhere in the estuary (Poppe and others., 1998d).
In some localized areas, beds composed
largely of shell debris cover the bottom, providing a unique habitat.
Although not shown on the texture map, these beds commonly occur adjacent
to sandy shoals where strong tidal currents can winnow mollusc shells from
the shoal crest and deposit them in a basal apron around the shoal front
(Poppe and others, 1999b).
Ellis, C.W., 1962, Marine sedimentary environments in the vicinity of the Norwalk Islands, Connecticut: State Geological and Natural History Survey of Connecticut Bulletin 94, 89 p.
Fenster, M.S., Fitzgerald, D.M., Bohlen, W.F., Lewis, R.S., and Baldwin, C.T., 1990, Stability of giant sand waves in eastern Long Island Sound: Marine Geology, v. 91, p. 207-225.
Folk, R.L., 1974, The Petrology of Sedimentary Rocks: Austin, Hemphill Publishing Co., 182 p.
Friedrich, N.E., McMaster, R.L., Thomas, H.F., and Lewis, R.S., 1986, Non-energy resources - Connecticut and Rhode Island Waters: Final Report to the Minerals Management Service, 14-12-0001-30115, 55 p.
Haskell, N.L., 1977, Long Sand Shoal. Storrs: Ph.D. Thesis, University of Connecticut, Storrs, Connecticut, 142 p.
Knebel, H.J., Signell, R.P., Rendigs, R.R., Poppe, L.J., and List, J.H., 1999, Seafloor environments in the Long Island Sound estuarine system: Marine Geology, v. 155, p. 277-318.
Knebel, H.J., and Poppe, L.J., Sea-floor environments within Long Island Sound: A regional overview: Journal of Coastal Research, in press.
Lewis, R.S., and Stone, J.R., 1991, Late Quaternary stratigraphy and depositional history of the Long Island Sound basin: Connecticut and New York. In: P.T Gayes; R.S. Lewis, and H.J. Bokuniewicz (eds.) Quaternary Geology of Long Island Sound and Adjacent Coastal Areas: Journal Coastal Research Special Issue 11, pp. 1-23.
Lewis, R.S. and DiGiacomo-Cohen, M.L., A review of the geologic framework of the Long Island Sound basin with some observations relating to postglacial sedimentation: Journal of Coastal Research, in press.
McCave, I.N. and Syvitski, J.P.M., 1991, Principles and methods of particle size analysis. In: J.P.M. Syvitski (ed.), Principles, Methods, and Applications of Particle Size Analysis, New York: Cambridge University Press, p. 3-21.
Poppe, L.J., Lewis, R.S., Quarrier, S., and Zajac, R., 1994, Map showing the distribution of surficial sediments in Fishers Island Sound, New York, Connecticut, and Rhode Island: U.S. Geological Survey Miscellaneous Investigations Series Map I-2456, 1 sheet.
Poppe, L.J., Lewis, R.S., Zajac, R.N., Twichell, D.C., Schmuck, E.A., Parolski, K.F., and DiGiacomo-Cohen, M.L., 1997, Sidescan sonar image, surficial geologic interpretation, and bathymetry of the Long Island Sound sea floor off Hammonasset Beach State Park, Connecticut: U.S. Geological Survey Geologic Investigations Map MF-2588, 2 sheets.
Poppe, L.J., Hastings, M.E., DiGiacomo-Cohen, M.L., Manheim, F.T., and Mlodzinska, Z.J., 1998a, Surficial sediment database, In: L.J. Poppe and C. Polloni (eds.), Long Island Sound Environmental Studies: U.S. Geological Survey Open-File Report 98-502, Chapter 3, CD-ROM.
Poppe, L.J., Lewis, R.S., Denny, J.F., Parolski, K.F., DiGiacomo-Cohen, M.L., and Tolderlund, D.S., 1998b, Sidescan sonar image, surficial geologic interpretation, and bathymetry of the Long Island Sound sea floor in Niantic Bay and vicinity, Connecticut: U.S. Geological Survey Geologic Investigations Map I-2625, 2 sheets.
Poppe, L.J., Lewis, R.S., Denny, J.F., Parolski, K.F., and DiGiacomo-Cohen, M.L., 1998c, Sidescan sonar image, surficial geologic interpretation and bathymetry of Fishers Island Sound, Connecticut, New York, and Rhode Island: U.S. Geological Survey Geologic Investigations Series Map I-2640, 2 sheets.
Poppe, L.J., Lewis, R.S., Knebel, H.J., Haase, E.A., Parolski, K.F., and DiGiacomo-Cohen, M.L., 1998d, Sidescan sonar images, surficial geologic interpretations, and bathymetry of New Haven Harbor, Connecticut, and the New Haven Dumping Ground, north-central Long Island Sound, In: L.J. Poppe and C. Polloni (eds.), Long Island Sound Environmental Studies: U.S. Geological Survey Open-File Report 98-502, Chapter 2, no. 8, CD-ROM.
Poppe, L.J. and Eliason, A.H., 1999, An interactive computer program to extrapolate the clay fraction distributions of truncated grain-size data; U.S. Geological Survey Open-File Report 99-27, 44 p.
Poppe, L.J., Lewis, R.S., Denny, J.F., DiGiacomo-Cohen, M.L., and Parolski, K.F., 1999a, Sidescan sonar image, surficial geologic interpretation, and bathymetry of the Long Island Sound sea floor around Falkner Island, Connecticut: U.S. Geological Survey Geologic Investigations Series Map I-2671, 2 sheets.
Poppe, L.J., Lewis, R.S., Signell, R.P., Knebel, H.J., Persaud, M., Denny, J.F., Parolski, K.F., and DiGiacomo-Cohen, M.L., 1999b. Sidescan sonar image, surficial geologic interpretation, and bathymetry of the Long Island Sound sea floor off Roanoke Point, New York: U.S. Geological Survey Geologic Investigations Series Map I-2692, 1 sheet, 7 p.
Poppe, L.J., Knebel, H.J., Mlodzinska, Z.J., Hastings, M.E., and Seekins, B.A., Distribution of surficial sediment in Long Island Sound and adjacent waters: texture and total organic carbon: Journal of Coastal Research, in press.
Schlee, J., 1966, A modified Woods Hole rapid sediment analyzer: Journal Sedimentary Petrology, v. 30, p. 403-413.
Shepard, F.P., 1954, Nomenclature based on sand-silt-clay ratios: Journal Sedimentary Petrology, v. 24, p. 151-158.
Signell, R.P.; Knebel, H.J.; List, J.H., and Farris, A.S., 1998, Physical processes affecting sedimentary environments of Long Island Sound, In: M. Spaulding and A. Blumberg (eds.), Proceedings 5th International Conference on Estuarine and Coastal Modeling: New York, American Society of Civil Engineers, p. 400-412.
Twichell, D.C., Zajac, R., Poppe, L.J., Lewis, R.S., Cross, V.A., and Nichols, D., 1997, Sidescan sonar image, surficial geological interpretation, and bathymetry of the Long Island Sound sea floor off Norwalk, Connecticut: U.S. Geological Survey Geologic Investigations Map I-2589, 2 sheets.
Twichell, D.C.; Zajac, R.N.; Poppe, L.J.; Lewis, R.S.; Cross, V.A.; Nichols, D., and DiGiacomo-Cohen, M.L., 1998, Sidescan sonar image, surficial geologic interpretation, and bathymetry of the Long Island Sound sea floor off Milford, Connecticut: U.S. Geological Survey Geologic Investigations Map I-2632, 2 sheets.
Wentworth, C.K., 1929, Method of computing mechanical composition of
sediments: Geological Society of America Bulletin, v. 40, p. 771-790.
Figure 2. Index map showing the locations of continuous-coverage (hatched areas; Poppe and others, 1997, 1998b, c, , 1999a, b; Twichell and others, 1997, 1998) and reconnaissance (dashed lines; Knebel and others, 1999) sidescan sonar surveys used to extrapolate the textural data.
Figure 3. Map showing the distribution of surficial sediments in Long Island Sound and adjacent waters. Triangular and block diagrams explain the map units; certain textural categories were combined because of the paucity of some sediment types.