|
|
|
| Introduction | |
| Methods | |
| Distribution of Total Organic Carbon | |
| Acknowledgments | |
| References | |
| Figure Captions | |
| Digital Data and Metadata | |
| Back to Table of Contents | |
|
|
|

Chapter 5
|
|
|
| Introduction | |
| Methods | |
| Distribution of Total Organic Carbon | |
| Acknowledgments | |
| References | |
| Figure Captions | |
| Digital Data and Metadata | |
| Back to Table of Contents | |
|
|
|
Although sedimentary organic matter
is usually only a quantitatively minor component of marine sediments, it
affects many biologic, chemical, and geologic processes and, ultimately,
the character of the sediments themselves. Analyses of TOC are commonly
conducted as a measure of the total organic material, however, previous
studies have not outlined the regional distribution of TOC within the Sound.
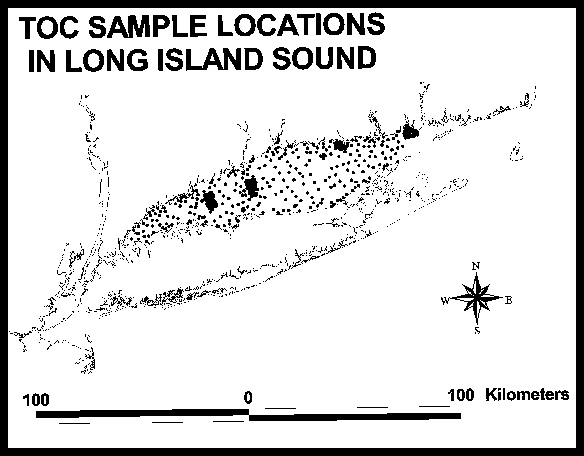 Surficial sediments (0-2 cm below the sediment-water interface) were sampled
at 580 locations within the Sound aboard the research vessels Asterias,
John
Dempsey, and Seaward
Explorer (Fig. 1).
These samples were placed in sealed containers aboard ship, and frozen
for later analysis. In the laboratory, these samples were thawed
and homogenized. A 0.5-g split was removed; large animals and shell
fragments were eliminated during sub-sampling. The samples were dried
at 60oC, ground to a fine (<62 µm) homogeneous powder,
placed in a desiccator containing concentrated HCL, and allowed to digest
for 24-48 hours to remove the carbonates. This vapor-phase acidification
converted the calcium carbonate in the sample to water vapor, CO2,
and calcium chloride (Zimmermann and others, 1992). After digestion,
the samples were disaggregated, re-dried at 60oC, and stored
in a desiccator until analysis. Analysis was performed using a Perkin
Elmer 2400 CHN Elemental Analyzer. About 40% of the CHN analyses
were standards, conducted to calibrate the instrument and check precision.
Precision was always better than one standard deviation. All TOC data were
salt corrected.
Surficial sediments (0-2 cm below the sediment-water interface) were sampled
at 580 locations within the Sound aboard the research vessels Asterias,
John
Dempsey, and Seaward
Explorer (Fig. 1).
These samples were placed in sealed containers aboard ship, and frozen
for later analysis. In the laboratory, these samples were thawed
and homogenized. A 0.5-g split was removed; large animals and shell
fragments were eliminated during sub-sampling. The samples were dried
at 60oC, ground to a fine (<62 µm) homogeneous powder,
placed in a desiccator containing concentrated HCL, and allowed to digest
for 24-48 hours to remove the carbonates. This vapor-phase acidification
converted the calcium carbonate in the sample to water vapor, CO2,
and calcium chloride (Zimmermann and others, 1992). After digestion,
the samples were disaggregated, re-dried at 60oC, and stored
in a desiccator until analysis. Analysis was performed using a Perkin
Elmer 2400 CHN Elemental Analyzer. About 40% of the CHN analyses
were standards, conducted to calibrate the instrument and check precision.
Precision was always better than one standard deviation. All TOC data were
salt corrected.
The TOC data from this project (Poppe and others, 1998d) were combined
with information from previous studies to produce a map and interpretation
(Poppe and others, in press). The preliminary map was manually contoured
on paper and photographed. The resultant negative was scanned to
create a TIF image file that was brought into ArcInfo. This image file
was geo-referenced using a projected tic coverage and the "register" and
"rectify" commands. Conversion of the geo-referenced image to a grid
was performed to 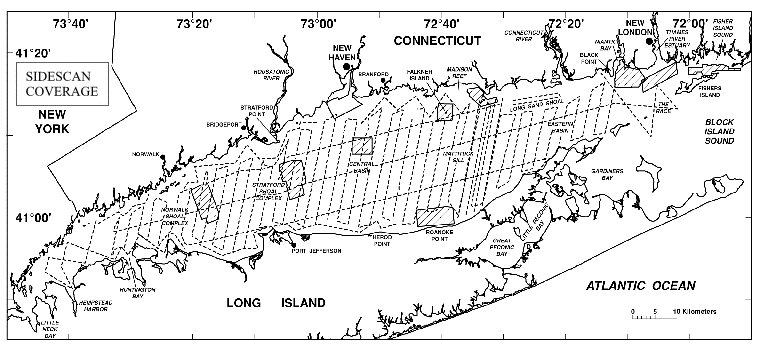 generate
a Universal Transverse Mercator (UTM) projection. Digitizing of the TOC
contours was performed on-screen in ArcView. This vector file was merged
with a coastline file to form a polygon shapefile and the polygons were
tagged with the TOC weight percentages as attributes. This shapefile
was converted to an ARCInfo coverage using the "shapearc", "clean", and
"regionpoly" commands. Bathymetry, backscatter data from continuous
and regional sidescan-sonar surveys (Fig.
2), and bottom videocamera data were used to extrapolate between
stations. Units on the TOC maps represent predominant concentrations;
small-scale heterogeneity is common. All contacts are inferred because
the transitions between the various map units are gradational and lateral
changes in TOC content are seldom abrupt.
generate
a Universal Transverse Mercator (UTM) projection. Digitizing of the TOC
contours was performed on-screen in ArcView. This vector file was merged
with a coastline file to form a polygon shapefile and the polygons were
tagged with the TOC weight percentages as attributes. This shapefile
was converted to an ARCInfo coverage using the "shapearc", "clean", and
"regionpoly" commands. Bathymetry, backscatter data from continuous
and regional sidescan-sonar surveys (Fig.
2), and bottom videocamera data were used to extrapolate between
stations. Units on the TOC maps represent predominant concentrations;
small-scale heterogeneity is common. All contacts are inferred because
the transitions between the various map units are gradational and lateral
changes in TOC content are seldom abrupt.
 The
map showing regional TOC concentrations contoured in weight percent of
the surficial sediments in Long Island Sound is presented in Figure
3. To open a georeferenced display of this theme in ESRI's
ArcView program make sure the application is loaded on your computer.
Users should go to the lisound directory located on the top
level of this CD-ROM and double click on the lisound.apr
project file. The individual ArcView shapefiles may also be opened
directly with any Arc application (e.g. ArcInfo, ArcExplorer) and can also
be found on the data page. Further
detailed information can be found on the ArcView
Project File page.
The
map showing regional TOC concentrations contoured in weight percent of
the surficial sediments in Long Island Sound is presented in Figure
3. To open a georeferenced display of this theme in ESRI's
ArcView program make sure the application is loaded on your computer.
Users should go to the lisound directory located on the top
level of this CD-ROM and double click on the lisound.apr
project file. The individual ArcView shapefiles may also be opened
directly with any Arc application (e.g. ArcInfo, ArcExplorer) and can also
be found on the data page. Further
detailed information can be found on the ArcView
Project File page.
The highest TOC values exceed 3% and occur north of Hempstead Harbor in the western Sound; the lowest values are less than 0.1% and occur along the north shore of Long Island in the eastern Sound (Poppe and others, in press). TOC concentrations in Long Island Sound are generally elevated relative to open-marine environments, but similar to TOC concentrations in the bottom sediments of most other U.S. east-coast estuaries (Gorsline, 1963; Froelich and others, 1971; Folger, 1972; Poppe and others, 1990).
Our TOC results generally agree with other previously reported concentrations in the Sound. For western Long Island Sound, Hathaway (1971) and Reid (1982) reported average TOC values of 1.79% and 2.77%, respectively. In the central Sound, Krishnaswami and others (1984) found average TOC values of 1.44%.
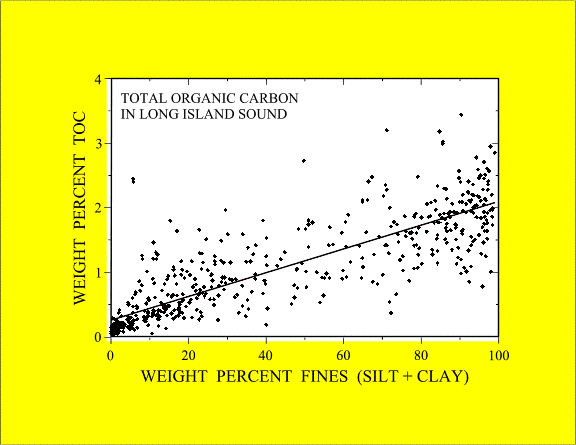 The
TOC concentrations in Long Island Sound vary inversely with grain size
(Fig. 4). Coarser-grained
sediments, such as gravelly sediments and sands, typically contain less
organic carbon than finer grained sediments, such as clayey silts.
TOC concentrations average 1.91% in clayey silts from the Sound, but only
0.37% in the sands. This inverse relationship has been observed elsewhere
along the United States east coast (Hulsemann, 1967; Froelich and others,
1971; Emery and Uchupi, 1972; Maciolek and others, 1986; Poppe and others,
1990),
The
TOC concentrations in Long Island Sound vary inversely with grain size
(Fig. 4). Coarser-grained
sediments, such as gravelly sediments and sands, typically contain less
organic carbon than finer grained sediments, such as clayey silts.
TOC concentrations average 1.91% in clayey silts from the Sound, but only
0.37% in the sands. This inverse relationship has been observed elsewhere
along the United States east coast (Hulsemann, 1967; Froelich and others,
1971; Emery and Uchupi, 1972; Maciolek and others, 1986; Poppe and others,
1990),
The inverse correlation between the amount of organic carbon and sediment texture is dependent on the fine-grained nature of the organic carbon, the adsorption of organic particles onto the charged surfaces of clay minerals, and the grain-surface area available for adsorption (Froelich and others, 1971; Mayer, 1994). Because of the relatively shallow nature of the Sound and because the finer-grained sediments tend to accumulate in lower energy environments, the depth or redox state of the overlying water column do not appear to be limiting factors in the distribution of TOC.
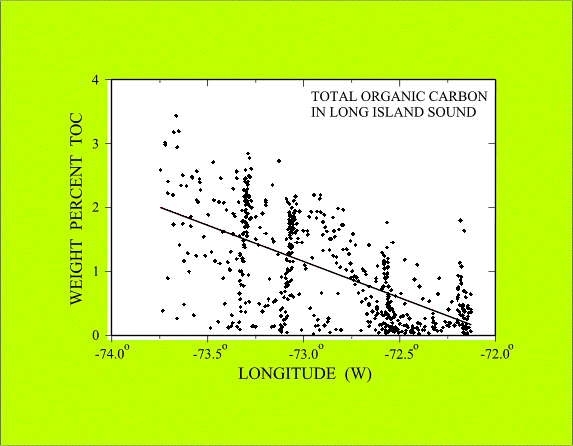 The
data from this study (Fig. 5)
and earlier work (Hathaway, 1971; Reid, 1982) suggest that TOC concentrations
generally increase westward within the Sound. For example, TOC concentrations
in clayey silts and sand off Stratford Point average only 1.76% and 0.80%,
respectively, but average 2.11% and 0.94%, respectively, off the Norwalk
Islands (Poppe and others, 1996). Similarly, TOC concentrations from
all samples analyzed in the western Sound average 1.46%, but only 0.61%
in the eastern Sound. This westward increase in TOC in the sediments
is probably related to higher nutrient inputs, to seasonal stratification
of the water column, and to the east-to-west progression of sedimentary
environments. Higher nutrient inputs result in a high production
rate of organic matter, whereas seasonal stratification promotes hypoxia
in the bottom waters, which increases preservation by limiting macro- and
microbiologic scavenging (Stein, 1990; Long Island Sound Study, 1994).
Lower energy environments in the central and western Sound allow the deposition
of fine-grained sediment, which contains more organic matter (Knebel and
others, 1999; Knebel and Poppe, in press; Poppe and others, in press).
The
data from this study (Fig. 5)
and earlier work (Hathaway, 1971; Reid, 1982) suggest that TOC concentrations
generally increase westward within the Sound. For example, TOC concentrations
in clayey silts and sand off Stratford Point average only 1.76% and 0.80%,
respectively, but average 2.11% and 0.94%, respectively, off the Norwalk
Islands (Poppe and others, 1996). Similarly, TOC concentrations from
all samples analyzed in the western Sound average 1.46%, but only 0.61%
in the eastern Sound. This westward increase in TOC in the sediments
is probably related to higher nutrient inputs, to seasonal stratification
of the water column, and to the east-to-west progression of sedimentary
environments. Higher nutrient inputs result in a high production
rate of organic matter, whereas seasonal stratification promotes hypoxia
in the bottom waters, which increases preservation by limiting macro- and
microbiologic scavenging (Stein, 1990; Long Island Sound Study, 1994).
Lower energy environments in the central and western Sound allow the deposition
of fine-grained sediment, which contains more organic matter (Knebel and
others, 1999; Knebel and Poppe, in press; Poppe and others, in press).
Data collected seasonally during 1995 as part of this study suggest a decrease in the amount of organic matter in the surficial sediments between spring and late summer. TOC concentrations average 1.73% in the samples collected during April, but average only 1.42% in samples collected at the same locations during August. This seasonal variability in the TOC, which has been noted by earlier studies along the United States mid-Atlantic slope and rise (Maciolek and others, 1986), is probably related to increased oxidation and macro-biologic reworking of the organic matter during the late spring and early summer.
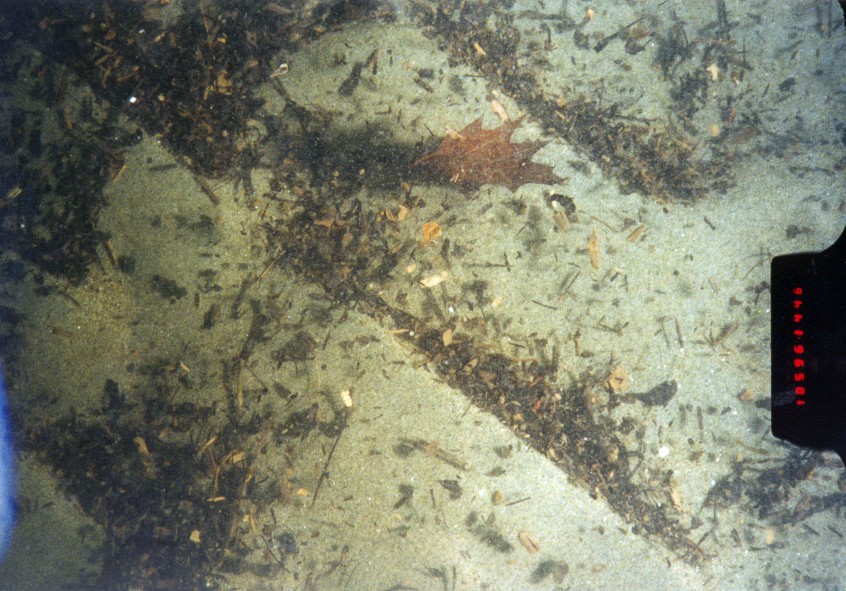 Sedimentary
organic matter in the marine environment is primarily derived from phytoplankton
and, to a lesser degree, from continental sources (Fig.
6). Because marine and land plants contain different amounts
of carbon and nitrogen, molar elemental carbon/nitrogen (C/N) ratios can
be used as a rough means of differentiating between algal and terrigenous
organic matter (Premuzic and others, 1982; Meyers, 1994). Aquatic
(marine and lacustrine) algae typically have atomic C/N ratios of less
than ten, whereas vascular land plants have C/N ratios greater than 20.
This difference arises from the absence of cellulose in algae and its abundance
in vascular plant material (Meyers, 1994). The C/N molar elemental
ratios from sediments near the Stratford shoal complex average 10.775 (Poppe
and others, 1996) and suggest that marine algae are the primary source
of sedimentary organic matter in this area. Although similar C/N
ratios are present in the sediments from most of the southern and central
parts of the Sound off Norwalk, those from near the northern shore are
much higher. The high ratios from this shoreward area commonly exceed
20 and suggest a more terrigenous source for the sedimentary organic matter.
Sedimentary
organic matter in the marine environment is primarily derived from phytoplankton
and, to a lesser degree, from continental sources (Fig.
6). Because marine and land plants contain different amounts
of carbon and nitrogen, molar elemental carbon/nitrogen (C/N) ratios can
be used as a rough means of differentiating between algal and terrigenous
organic matter (Premuzic and others, 1982; Meyers, 1994). Aquatic
(marine and lacustrine) algae typically have atomic C/N ratios of less
than ten, whereas vascular land plants have C/N ratios greater than 20.
This difference arises from the absence of cellulose in algae and its abundance
in vascular plant material (Meyers, 1994). The C/N molar elemental
ratios from sediments near the Stratford shoal complex average 10.775 (Poppe
and others, 1996) and suggest that marine algae are the primary source
of sedimentary organic matter in this area. Although similar C/N
ratios are present in the sediments from most of the southern and central
parts of the Sound off Norwalk, those from near the northern shore are
much higher. The high ratios from this shoreward area commonly exceed
20 and suggest a more terrigenous source for the sedimentary organic matter.
Folger, D.W., 1972, Texture and organic carbon content of bottom sediments in some estuaries of the United States: Geological Society of America Memoir 133, p. 391-408.
Froelich, P., Golden, B., and Pilkey, O.H., 1971, Organic carbon in sediments of the North Carolina continental rise: Southeastern Geology, v. 13, p. 91-97.
Gorsline, D.S., 1963, Bottom sediments of the Atlantic shelf and slope off the southeastern United States: Journal of Geology, v. 71, p. 422-440.
Hathaway, J.C., 1971, Data file - continental margin program: Woods Hole Oceanographic Institution Technical Report 71-15, 492 p.
Hulsemann, J., 1967, Der Kontinental Schelf-geologische Grenze Land/Meer: Umschau, 4, p. 105-111.
Knebel, H.J., Signell, R.P., Rendigs, R.R., Poppe, L.J., and List, J.H., 1999, Seafloor environments in the Long Island Sound estuarine system: Marine Geology, 155, 277-318.
Knebel, H.J., and Poppe, L.J., Sea-floor environments with Long Island Sound: a regional overview: Journal of Coastal Research, in press.
Krishnaswami, S., Monaghan, M.C., Westrich, J.T., Bennett, J.T., and Turekian, K.K., 1984, Chronologies of sedimentary processes in sediments of the FOAM site, Long Island Sound, Connecticut: American Journal Science, v. 284, p. 706-733.
Long Island Sound Study, 1994, The Long Island Sound Study - The Comprehensive Conservation and Management Plan: 168 p.
Maciolek, N., Grassle, J.F., Hecker, B., Boehm, P.D., Brown, B., Dade, B., Steinhauer, W.G., Baptiste, E.; Ruff, R.E., and Petrecca, R., 1986, Study of biologic processes on the U.S. Mid-Atlantic slope and rise: Final Report to the Department of the Interior, Minerals Management Service, MMS Contract No. 14-12-0001-30064, 314 p.
Mayer, L.M., 1994, Relationships between mineral surfaces and organic carbon concentrations in soils and sediments: Chemical Geology, v. 114, p. 347-363.
Meyers, P.A., 1994, Preservation of elemental and isotopic source identification of sedimentary organic matter: Chemical Geology, v. 114, p. 289-302.
Poppe, L.J., Schlee, J.S., Lane, C.M., 1990, Map showing weight percent of the total organic carbon in the surficial sediments of the Mid-Atlantic Continental Margin, Cape Cod to Albemarle Sound: U.S. Geological Survey Miscellaneous Investigations Series Map I-1987-B, 1 sheet.
Poppe, L.J.; Zajac, R.N., Lewis, R.S., Mlodzinska, Z.J., Pratt, S.E., Taylor, B.B., and DiGiacomo-Cohen, M.L., 1996, Organic carbon, hydrogen, and nitrogen concentrations in surficial sediments from western Long Island, Connecticut and New York: U.S. Geological Survey Open-File Report 96-708, 20 p.
Poppe, L.J., Lewis, R.S., Zajac, R.N., Twichell, D.C., Schmuck, E.A., Parolski, K.F., and DiGiacomo-Cohen, M.L., 1997, Sidescan sonar image, surficial geologic interpretation, and bathymetry of the Long Island Sound sea floor off Hammonasset Beach State Park, Connecticut: U.S. Geological Survey Geologic Investigations Map I-2588, 2 sheets.
Poppe, L.J., Lewis, R.S., Denny, J.F., Parolski, K.F., DiGiacomo-Cohen, M.L., and Tolderlund, D.S., 1998a, Sidescan sonar image, surficial geologic interpretation, and bathymetry of the Long Island Sound sea floor in Niantic Bay and vicinity, Connecticut: U.S. Geological Survey Geologic Investigations Map I-2625, 2 sheets.
Poppe, L.J., Lewis, R.S., Denny, J.F.; Parolski, K.F., and DiGiacomo-Cohen, M.L., 1998b, Sidescan sonar image, surficial geologic interpretation and bathymetry of Fishers Island Sound, Connecticut, New York, and Rhode Island: U.S. Geological Survey Geologic Investigations Series Map I-2640, 2 sheets.
Poppe, L.J., Lewis, R.S., Knebel, H.J.;,Haase, E.A., Parolski, K.F., and DiGiacomo-Cohen, M.L., 1998c, Sidescan sonar images, surficial geologic interpretations, and bathymetry of New Haven Harbor, Connecticut, and the New Haven Dumping Ground, north-central Long Island Sound, In: L.J. Poppe and C. Polloni (eds.), Long Island Sound Environmental Studies, U.S. Geological Survey Open-File Report 98-502, Chapter 2, no. 8, CD-ROM.
Poppe, L.J., Hastings, M.E., DiGiacomo-Cohen, M.L., Manheim, F.T., and Mlodzinska, Z.J., 1998d, Surficial sediment database, In: L.J. Poppe and C. Polloni (eds.), Long Island Sound Environmental Studies, U.S. Geological Survey Open-File Report 98-502, Chapter 3, CD-ROM.
Poppe, L.J., Lewis, R.S., Denny, J.F., DiGiacomo-Cohen, M.L., and Parolski, K.F., 1999a, Sidescan sonar image, surficial geologic interpretation, and bathymetry of the Long Island Sound sea floor around Falkner Island, Connecticut: U.S. Geological Survey Geologic Investigations Series Map I-2671, 2 sheets.
Poppe, L.J., Lewis, R.S., Signell, R.P., Knebel, H.J., Persaud, M., Denny, J.F., Parolski, K.F., List, J.H., and DiGiacomo-Cohen, M.L., 1999b. Sidescan sonar image, surficial geologic interpretation, and bathymetry of the Long Island Sound sea floor off Roanoke Point, New York: U.S. Geological Survey Geologic Investigations Series Map I-2692, 1 sheet, 7 p.
Poppe, L.J., Knebel, H.J., Mlodzinska, Z.J., Hastings, M.E., and Seekins, B., The distribution of surficial sediment in Long Island Sound and adjacent waters: texture and total organic carbon: Journal of Coastal Research, in press.
Premuzic, E.T., Benkovitz, C.M., Gaffney, J.S., and Walsh, J.J., 1982, The nature and distribution of organic matter in the surface sediments of the world oceans and seas: Organic Chemistry, v. 4, p. 63-77.
Reid, R.N., 1982, Sediment granulometry, organic carbon, and nitrogen. In: R.N. Reid, J.E. O'Reilly, and V.S. Zdanowicz (eds.), Contaminants in New York Bight and Long Island Sound Sediments and Demersal Species, and Contaminant Effects on Benthos, Summer 1980, National Oceanic and Atmospheric Administration Technical Memorandum NMFS-F/NEC-16, 96 p.
Stein, R., 1990, Organic carbon content/sedimentation rate relationship and its paleoenvironmental significance for marine sediments: Geo-Marine Letters, v. 10, p. 37-44.
Twichell, D.C., Zajac, R., Poppe, L.J., Lewis, R.S., Cross, V.A., and Nichols, D., 1997, Sidescan sonar image, surficial geological interpretation, and bathymetry of the Long Island Sound sea floor off Norwalk, Connecticut: U.S. Geological Survey Geologic Investigations Series Map I-2589, 2 sheets.
Twichell, D.C., Zajac, R.N., Poppe, L.J., Lewis, R.S., CROSS, V.A., NICHOLS, D., and DiGiacomo-Cohen, M.L., 1998, Sidescan sonar image, surficial geologic interpretation, and bathymetry of the Long Island Sound sea floor off Milford, Connecticut: U.S. Geological Survey Geologic Investigations Series Map I-2632, 2 sheets.
Zimmermann, C.F.; Keefe, C.W., and Bashe, J., 1992, Method 440.0 - Determination
of carbon and nitrogen in sediments and particulates of estuarine/coastal
waters using elemental analysis: U.S. Environmental Protection Agency Environmental
Monitoring and Support, Supplement to Methods for Chemical Analysis and
Waste, National Technical Information Service, Washington, D.C., U.S. Department
of Commerce, Revision 1.4, sec. 11.4.2.
Figure 2. Index map showing the locations of continuous-coverage (hatched areas; Poppe and others, 1997, 1998a, 1998b, 1998c, 1999a, 1999b; Twichell and others, 1997, 1998) and reconnaissance (dashed lines; Knebel and others, 1999) sidescan sonar surveys used to extrapolate the textural data.
Figure 3. Map showing the distribution of TOC in the sediments of Long Island Sound. Contours are in weight percent; block diagrams explain map units.
Figure 4. Plot showing the general relationship between increasing TOC percentages and decreasing grain size.
Figure 5. Plot showing the westward increase in TOC concentrations in Long Island Sound.
Figure 6. Bottom photograph from near the mouth of the Connecticut River. Note the coarse terrigenous organic debris collecting in the troughs of current ripples.