|
|
|
| Abstract | |
| Introduction | |
| Methods | |
| Results | |
| Conclusion | |
| Acknowledgments | |
| References | |
| Figure Captions | |
| Table Captions | |
| Digital Data and Metadata | |
| Back to Table of Contents | |
|
|
|

Chapter 8
|
|
|
| Abstract | |
| Introduction | |
| Methods | |
| Results | |
| Conclusion | |
| Acknowledgments | |
| References | |
| Figure Captions | |
| Table Captions | |
| Digital Data and Metadata | |
| Back to Table of Contents | |
|
|
|
 Discharges
from urban centers, industrial and agricultural activities, and population
growth have impacted the water and sediment quality of Long Island Sound
for more than two centuries (Fig. 1a
and 1b). Pollutants enter in
the form of sewage effluent, industrial discharge, dredge spoils, urban
runoff, riverine discharge, and atmospheric deposition. The potential
for adverse environmental effects, plus management concerns (U.S. EPA,
1994), prompted the U.S. Geological Survey
to undertake a multidisciplinary study (Poppe and Polloni, 1998; Buchholtz
ten Brink and others, 2000, and citations therein) to assess the influence
of geologic processes on the ecosystem of the Sound. Concentrations of
Clostridium
perfringens spores in the sediments of Long Island Sound are used in
this study as a tracer of sedimentary processes, as a proxy for other contaminants,
and a historical indicator of sewage-derived pollutants to Long Island
Sound.
Discharges
from urban centers, industrial and agricultural activities, and population
growth have impacted the water and sediment quality of Long Island Sound
for more than two centuries (Fig. 1a
and 1b). Pollutants enter in
the form of sewage effluent, industrial discharge, dredge spoils, urban
runoff, riverine discharge, and atmospheric deposition. The potential
for adverse environmental effects, plus management concerns (U.S. EPA,
1994), prompted the U.S. Geological Survey
to undertake a multidisciplinary study (Poppe and Polloni, 1998; Buchholtz
ten Brink and others, 2000, and citations therein) to assess the influence
of geologic processes on the ecosystem of the Sound. Concentrations of
Clostridium
perfringens spores in the sediments of Long Island Sound are used in
this study as a tracer of sedimentary processes, as a proxy for other contaminants,
and a historical indicator of sewage-derived pollutants to Long Island
Sound.
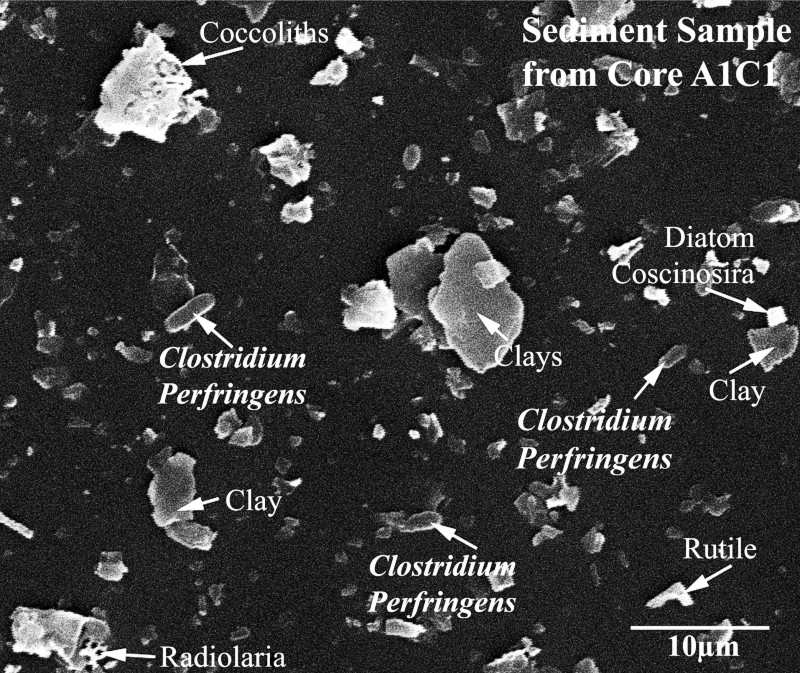
Clostridium perfringens, an enteric bacterium, is present in the intestinal tract of mammals. This bacteria, and its endospores, are excreted in human fecal material, pass through the sewage treatment process, and are discharged with effluent and sludge into the environment (NRC, 1993). The spores are inert in most temperate marine sediments (Rippey and Watkins, 1992; Davies and others, 1995) as both anoxia and elevated temperatures are necessary for significant growth. Consequently, the presence of Clostridium perfringens spores in sediment (Fig. 2) provides an excellent tracer and recorder of sewage input into an ecosystem (Parmenter and Bothner, 1993; Lucena and others, 1996; Watkins and Burkhardt, 1996) and has been used elsewhere as an indicator of sewage contamination in the sediments (e.g., Matches and others, 1974; Valente and others, 1992; Cabelli and others, 1984; Hill and others, 1993; Draxler and others, 1996; Sawyer and others, 1996; Shanavis, 1998; Edwards and others, 1998). In Long Island Sound, ambient sedimentary conditions are not favorable for Clostridium perfringens growth so the concentrations measured in sediments from Long Island Sound are expected to provide an estimate of the location and magnitude of sewage contamination in the Sound. The patterns of Clostridium perfringens found in sediments provide both a record of past sewage contamination and a means to characterize the processes that transport contaminants since the large-scale geologic processes of sedimentation, burial, resuspension, and winnowing affect the transport and accumulation of both sediments and contaminants, such as Clostridium perfringens spores, that are associated with them. In Long Island Sound, Clostridium perfringens concentration distribution for the last few decades may be a minimum estimate of sewage input, however, as recent improvements in sewage treatment procedures may have reduced the discharge per capita of spores (Hirata and Kawamura, 1993) from Waste Water Treatment Plants (WWTPs). In addition to directly tracing sewage, the concentrations of these spores are a valuable tracer for the magnitude and distribution of other urban contaminants in sediments because sewage discharge is often a significant source of pollutant metals (e.g., silver (Ag), copper (Cu), zinc (Zn), mercury (Hg)) and other contaminants in coastal waters (Farrow and others, 1986; U.S. EPA, 1997; Benoit and others, 1999).
Sediment cores were collected in 1996 and surface sediments in 1996-1997
at locations throughout the Sound. The concentration of Clostridium
perfringens in these sediment core and surface samples is reported
here in tabular and graphical format, and the interpretation of the observed
distribution is discussed in Buchholtz ten Brink and others, 2000.
 Sediment
cores for geochemical analysis were collected in June 1996 at 58 stations
along north-south transects (Fig. 3;
Table
1). Core sites were selected to include: (1) areas that are representative
of particular sedimentary environments (Knebel and others, 1998); (2) transects
seaward of known contaminant sources; (3) regions where sidescan mosaics
and biological community data were available (Poppe and Polloni, 1998);
and (4) sites offshore of land-based studies (Varekamp and Scholand, 1996).
In addition, 219 surficial samples were obtained that provided spatial
coverage. These were collected along seismic track-lines in 1996, and in
western Long Island Sound in 1997 (Buchholtz ten Brink and Mecray, 1998;
Mecray and others, this CD-ROM).
Sediment
cores for geochemical analysis were collected in June 1996 at 58 stations
along north-south transects (Fig. 3;
Table
1). Core sites were selected to include: (1) areas that are representative
of particular sedimentary environments (Knebel and others, 1998); (2) transects
seaward of known contaminant sources; (3) regions where sidescan mosaics
and biological community data were available (Poppe and Polloni, 1998);
and (4) sites offshore of land-based studies (Varekamp and Scholand, 1996).
In addition, 219 surficial samples were obtained that provided spatial
coverage. These were collected along seismic track-lines in 1996, and in
western Long Island Sound in 1997 (Buchholtz ten Brink and Mecray, 1998;
Mecray and others, this CD-ROM).
Sediment cores were collected using the U.S. Geological Survey's hydrostatically- damped gravity corer (Bothner and others, 1997), which collected 11-cm diameter cores up to 70 cm in length in clear, polycarbonate tubing. The corer was operated in both the piston and the piston-free modes. The piston mode provided slightly longer cores, whereas the piston-free mode provided slightly better sediment surfaces. Use of this corer minimized the disturbance of the sediment surface and made measurements of detailed gradients near the sediment-water interface possible. Between one and six replicate cores were collected at 29 of the stations. The overlying water collected in the corer was clear, and features on the surface (e.g., fecal pellets) were distinct. A video camera was mounted on the frame of the corer and recorded the entry of the corer into the sediment. The video also allowed the core to be taken in a representative location, avoided placement of the sampling gear in dangerous spots, and recorded any leakage from the bottom of the core. On deck, the cores were capped, described, and stored vertically in a refrigerator (or archived frozen) for later sectioning and analysis. Overlying water was retained in the core barrel to reduce disturbance of the sediment interface, and salinity values were measured with a hand-held refractometer.
A Van-Veen grab sampler was used to collect the surface sediments. The grab sampler also had downward-looking video and still cameras attached in order to characterize the bottom and verify the integrity of the grab. After photographing and describing the sediment surface on deck, the overlying water was removed, and the upper 2-cm of sediment were collected with a Teflon-coated flat-bottom scoop. The sediment sample was placed in a pre-cleaned (5% HNO3, distilled water, and methanol rinse) plastic container and homogenized. Aliquots were then taken for later analysis of Clostridium perfringens spores, grain size (Poppe and others, 1998), and sediment chemistry (Mecray and Buchholtz ten Brink, 2000).
On shore, X-radiographs were taken of all cores (in an upright position) to document fine-scale lithological features and provide insight for core sectioning. Immediately prior to sectioning, the overlying water was removed and profiles of bulk density and magnetic susceptibility were determined on each whole core with a multi-sensor core logger (MSCL; Boyce, 1973). Cores were then vertically extruded and sectioned with titanium spatulas at 0.5-cm or 1.0-cm intervals, taking care to trim edges which may have been smeared during the process. Replicate cores were sectioned from stations A1, A3, B5, and C1. After three years of frozen storage at temperatures below -10° C, replicate cores from stations M1, B5, D1, E4, and G3 were sectioned in 2-cm intervals. All surfaces contacting the sediment (core barrels, sampling spatulas, aliquot containers) were rinsed with dilute acid (5% HNO3), distilled water, and methanol and then air-dried in a laminar-flow hood. Each sediment section was homogenized, and an aliquot of wet sediment was removed for Clostridium perfringens analysis. Sectioning of all cores occurred at room temperature, and Clostridium perfringens aliquots were refrigerated immediately after slicing. The remaining wet samples were weighed, freeze-dried, water content was determined by weight loss, and the samples were archived for further analysis. Sediments from the grab samples (0-2 cm) were collected and prepared in a similar manner (Buchholtz ten Brink and Mecray, 1998; Mecray and Buchholtz ten Brink, 2000).
Concentrations of Clostridium perfringens spores were determined by the membrane filtration and enumeration method of Bisson and Cabelli (1979) and Emerson and Cabelli (1982), which is detailed in U.S. EPA (1995). Sample size was between 1 and 5 g of wet sediment, and each reported value is the average of two measurements. A portion of the sample was dried to determine the water content value used for conversion of measured data from units of spores per mass of wet sediment to reported values of spores per mass of dry sediment. Replicates were analyzed approximately every tenth sample, which resulted in a range of error from 2% to 30%, although most of the replicates had less than 15% error. The analytical blank for Clostridium perfringens was zero counts and the median detection limit for the method was 7 ± 8 spores/g dry sediment (n=156), with detection limit values as low as 2 spores/g dry sediment and 97% of the detection limit values were <16 spores/g dry sediment. Values measured as non-detectable are considered to indicate uncontaminated, naturally-occurring background values.
Grain size was determined for the grab samples on wet sediments using standard laboratory methods (Folk, 1974; Poppe and others, 1985). The fine fraction of the sediment (% fines) was calculated as the silt-size fraction plus the clay-size fraction (i.e., <63µm), in weight percent. Major and trace elements were determined by total digestion followed by Inductively Coupled Plasma Emission Spectrometry (Murray and Leinen, 1996; Mecray and Buchholtz ten Brink 2000). X-radiographs and camera images used in interpreting the Clostridium perfringens distribution and transport were transferred from film to digital format.
The MSCL analysis provided a continuous measure (0.5-cm intervals) of gamma-ray attenuation on the whole cores that was proportional to the sediment bulk density. This was compared to discrete measurements of water content on core aliquots to verify the accuracy of both methods and to estimate the variability in grain density. A grain density of 2.6 g/cm2 was used to calculate wet- and dry- bulk density from measurements of MSCL attenuation and discrete water content analysis. Inventories of Clostridium perfringens in each core (spores/cm2) were calculated by multiplying the Clostridium perfringens concentration (spores/g wet sediment) in each sediment interval by the corresponding wet bulk density (g/cm3) and integrating over the length of the core. The calculated inventories are minimum values for cores that did not reach non-detectable, background values of Clostridium perfringens at depth.
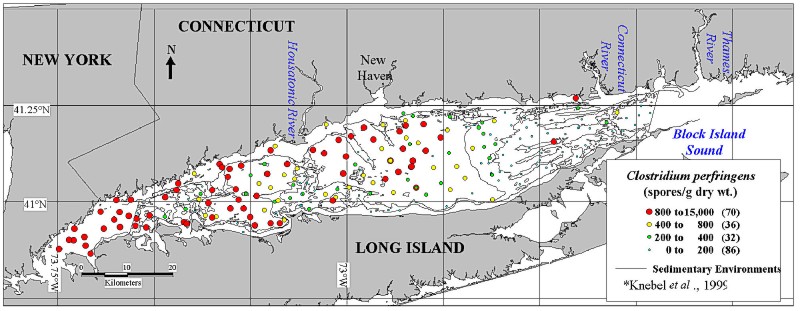
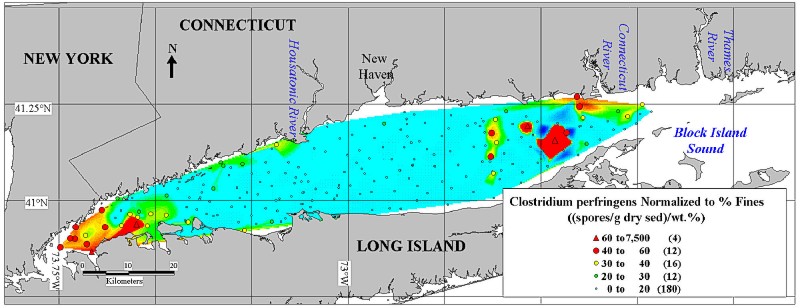
Clostridium perfringens concentrations in the surficial interval (0-2 cm) range from non-detectable concentrations to 15,000 spores/g dry sediment (Fig. 4a). The highest values are found in the western end of the Sound; very low, or non-detectable values, are found in the eastern region; and intermediate values are measured in the central and western basins. A triangulation-gridding technique was used to interpolate the Clostridium perfringens concentrations for the surface sediments of the entire Sound (Fig. 4b). This distribution pattern is attributed to both sediment transport processes, which control sediment grain size (Fig. 4c), and proximity of the sediments to Clostridium perfringens sources (Buchholtz ten Brink and others, 2000).
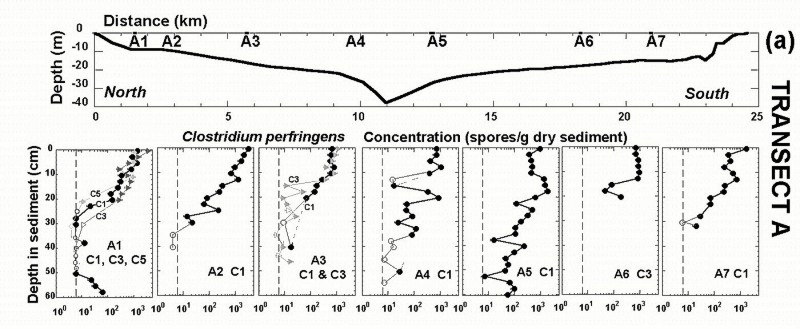
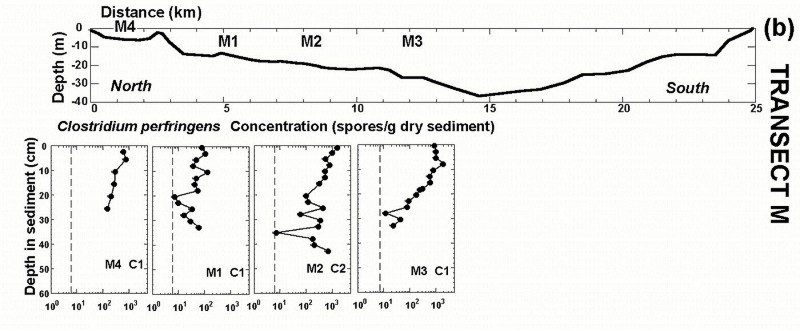
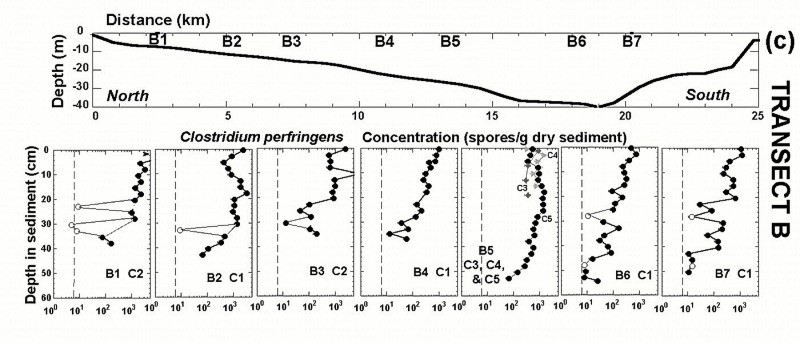
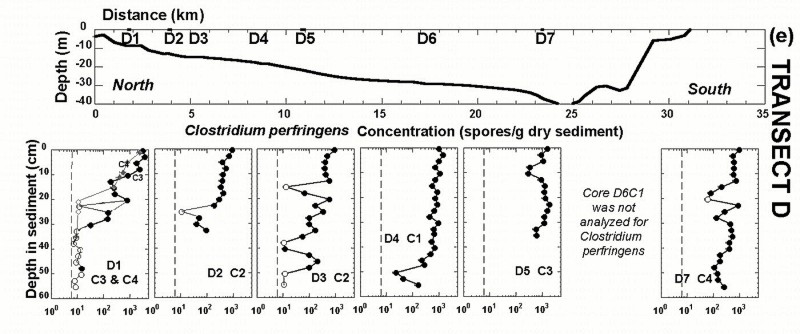
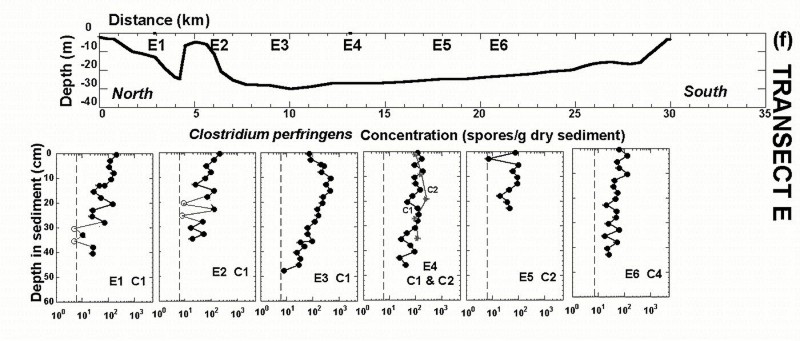
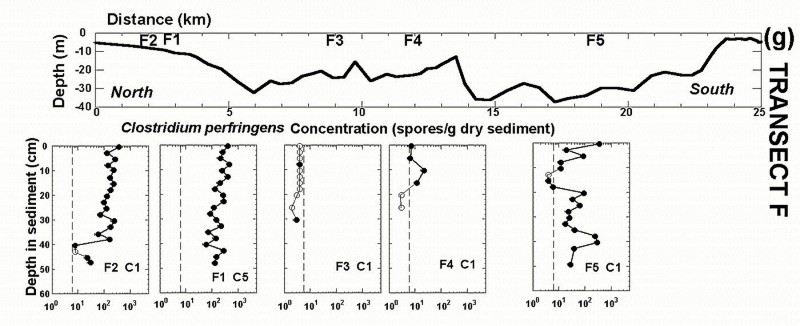
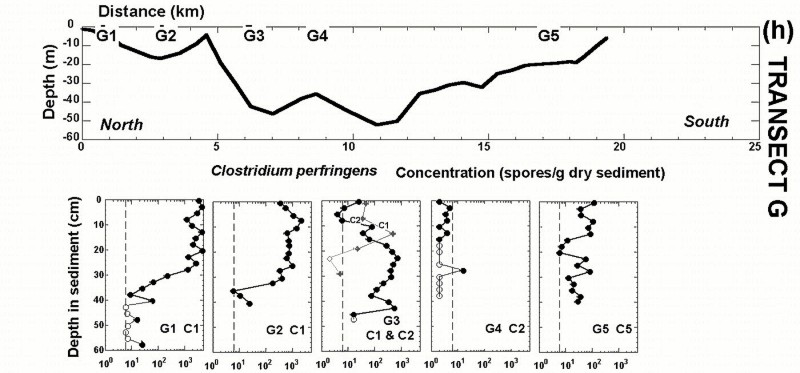
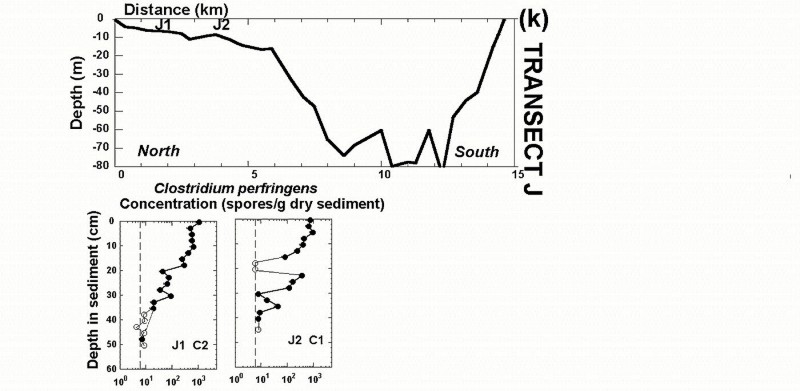
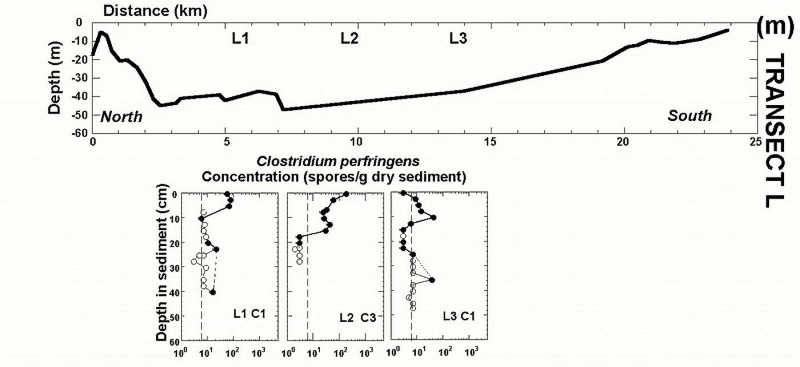
Profiles of Clostridium perfringens in sediment cores (Fig. 5a, 5b, 5c, 5d, 5e, 5f, 5g, 5h, 5i, 5j, 5k, 5l, and 5m) show concentrations above background levels from the core surface to depths of approximately 30 cm in cores that are from all regions of the Sound. The concentrations in modern and surficial muddy sediments, however, are more than 10 times greater than concentrations in sandy sediments. There are steep gradients in the Clostridium perfringens profiles of the muddier cores, which are located in the depositional regions. Several cores from depositional areas (e.g., cores from stations A1, A2, A4, B6, B7, D1, D3, and G1) have Clostridium perfringens spore counts in deeper sections of the core (= 40-50 cm) that are below the detection limit. Shorter cores (<40 cm) that were recovered from depositional areas do not reach background concentrations at depth (i.e., cores from stations A6, M1, B3, B4, C4, C5, D2, D5). The low counts (<6 spores/g dry sediment) at depth indicate pre-pollutant, presumably pre-industrial conditions where there was no measurable anthropogenic contribution of Clostridium perfringens to the sediment. The Clostridium perfringens concentrations gradually increase upwards, and then sharply increase to reach values 100 times greater than background in the upper section (10-40 cm in thickness) of the cores.
In the western and central basins (transects A, M, B, C, D, and E), cores from 31 out of 35 stations had Clostridium perfringens concentrations that increased or remained constant to the core top, while four stations (A5, M3, B5, and E3) had values that dropped by an order of magnitude. The trend of Clostridium perfringens increasing to the present for most of the cores from Long Island Sound is unlike the trends of decreasing values seen for metal contaminants in sediments deposited in recent decades (Mecray and Buchholtz ten Brink, 2000; Varekamp and others, 2000). The cores from station B1 had particularly high concentrations of Clostridium perfringens, metal contaminants (although decreasing), and fast sediment accumulation. The proximity to the mouth of the Housatonic River and the city of Bridgewater are probable sources for the continued influx of these contaminants.
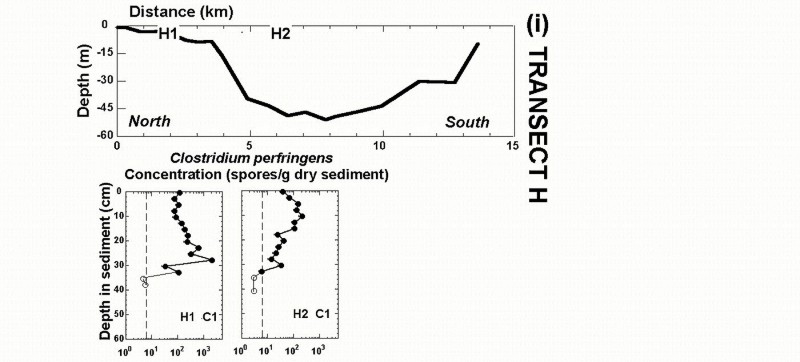
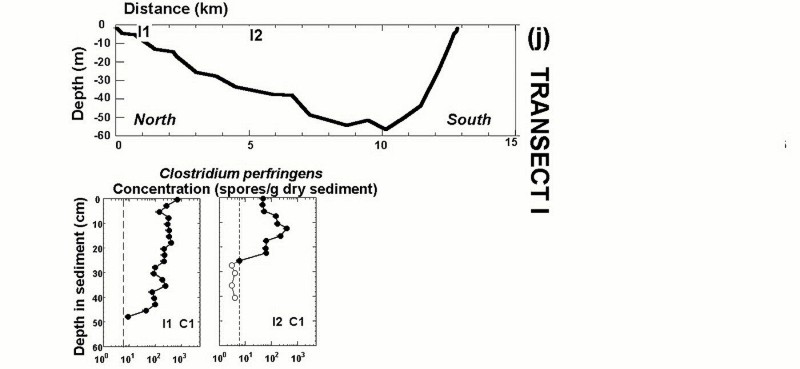
Sandy cores were collected from locations where bottom stress is high and sediment winnowing is active (e.g., stations from Transects E and F). Clostridium perfringens concentrations in these cores range from background to values approximately 10 times greater than background, with Clostridium perfringens concentrations that are relatively constant with depth in the cores. The observed uniformity with depth is consistent with active reworking of the sea floor in this region. Cores from stations F3, F4, and G4 have spore concentrations that are consistently less than 25 spores/g dry sediment at all depths, consistent with non-deposition of fine-grained sediments or spores in this area. Cores that were collected on transects H, J, and I have profiles similar to those in depositional areas to the west, where background values of Clostridium perfringens occur at depth and some cores (I1, J1, and J2) have concentrations that continue to increase towards the surface.
Replicate cores were analyzed for selected sites to provide an assessment
of limitations due to spatial heterogeneity and potential storage artifacts.
Examination of x-radiographs and MSCL density measurements for replicate
cores showed that the depositional character was comparable. Small variations
in density or porosity were easily correlated between cores, although present
at slightly different depths. The replicate stations also recorded little  intra-station
heterogeneity in profiles of Clostridium perfringens and long-term
freezing did not result in significant loss of viability. In general, the
ranges of concentrations and profile features found for
Clostridium
perfringens throughout the Sound were much greater than the range of
uncertainty due to either intra-station variability or storage artifacts.
intra-station
heterogeneity in profiles of Clostridium perfringens and long-term
freezing did not result in significant loss of viability. In general, the
ranges of concentrations and profile features found for
Clostridium
perfringens throughout the Sound were much greater than the range of
uncertainty due to either intra-station variability or storage artifacts.
X-radiographs (Fig. 6), density
and water-content profiles, and grain-size analyses identify layers where
sandier material was introduced into generally muddy, depositional cores.
These layers are recorded in the Clostridium perfringens temporal
record as low values, showing the effect of lithology on spore count (Buchholtz
ten Brink and Mecray, 1998). Sand layers carry a Clostridium perfringens
signal that could be mistaken for a decrease in input if lithology is not
noted and corrections made by normalization to lithological tracers such
as grain size, % iron, or % aluminum.
Bisson, J.W. and Cabelli, J.J., 1979, Membrane filter enumeration method for Clostridium perfringens:. Applied and Environmental Microbiology, v. 37, p. 55-66.
Bothner, M.H., Gill, P.W., Boothman, W.S., Taylor, B.B, and Karl, H.A., 1997, Chemical and textural characteristics of sediment at an EPA reference site for dredged material on the continental slope S.W. of the Farallon Islands: U.S. Geological Survey Open-File Report 97-87, 50 p.
Boyce, R.E., 1973. Physical properties- Methods: Initial Reports of the Deep Sea Drilling Program, v. 15, p. 1115-1127.
Buchholtz ten Brink, M.R. and Mecray, E.L., 1998, Contaminant distribution and accumulation in sediments of Long Island Sound: Field work and initial results. In: L.J. Poppe and C. Polloni (eds.), Long Island Sound Environmental Studies.: U.S. Geological Survey Open-File Report 98-502; 1 CD-ROM.
Buchholtz ten Brink, M.R. and Galvin, E.L., Physical properties of sediment cores collected in 1996 from Long Island Sound.: U.S. Geological Survey Open-File Report, CD-ROM, in preparation.
Buchholtz ten Brink, M.R.; Mecray, E.L., and Galvin, E.L., 2000, Clostridium perfringens in Long Island Sound Sediments: An Urban Sedimentary Record: Journal of Coastal Research, in press.
Cabelli, V.J., Duncanson, R.L., Gaines, J.L., Pedersen, D., Sims, R.R., and Shokes, R.F., 1984, Chemical and microbial tracers for the deposition and movement of sewage particulates. In: Oceans "84 Conference Record: Industry, Government, Education, Designs for the Future, pp. 272-277.
Davies, C.M., Long, J.A., Donald, M., and Ashbolt, N.J., 1995, Survival of fecal micro-organisms in marine and freshwater sediments: Applied and Environmental Microbiology, v. 61, p. 1888-1896.
Draxler, A.F.J., Zdanowicz, V., Deshpande, A.D., Finneran, T.; Arlen, L., Packeri, D., Davis, W., and White, H., 1996, Physical, chemical and microbial properties of sediments at the 106-Mile sewage sludge dumpsite: Journal of Marine Environmental Engineering, v. 2, p.343-368.
Edwards, D.D., McFeters, G.A., and Venkatesan, M.I., 1998, Distribution of Clostridium perfringens and fecal sterols in a benthic coastal marine environment influences by the sewage outfall from McMurdo Station, Antarctica: Applied and Environmental Microbiology, v. 64, p. 2596-2600.
Emerson, D.J. and Cabelli, V.J., 1982, Extraction of Clostridium perfringens spores from bottom sediment samples. Applied and Environmental Microbiology, v. 44, p. 1144-1149.
Farrow, D.R.G., Arnold, F.D., Lombardi, M.L. Main, M.B., and Eichelberger, P.D., 1986, The National Coastal Pollutant Discharge Inventory: Estimates for Long Island Sound, Selected Appendices (II-VIII), NOAA-NOS Report SEA 86-06, 74 p.
Folk, R.L., 1974, The Petrology of Sedimentary Rocks. Austin, Texas: Hemphill Publishing Company, 182 p.
Hill, R., Knight, I.T., Anikis, M.S., and Colwell, R.R., 1993, Benthic distributions of sewage sludge indicated by Clostridium perfringens at a deep-ocean dump site: Applied and Environmental Microbiology, v. 59, p. 47-51.
Hirata, T. and Kawamura, K. 1993, Removal efficiencies of microorganisms in wastewater treatment processes: Water Science Technology, v. 28, p. 55-61.
ICPSR (Inter-University Consortium for Political and Social Research), 1999, United States historical census data browser: Census data files for 1790-1970, Online at http://fisher.lib.virginia.edu/census.
Knebel, H.J. and Poppe, L.J., 2000. Sea-floor environments within Long Island Sound: A regional overview. Thematic section. Journal of Coastal Research. In press.
Knebel, H.J., Signell, R.P., Rendigs, R.R., Poppe, L.J., and List, J.H., 1998, Maps and illustrations showing the acoustic and textural characteristics and the distribution of bottom sedimentary environments in Long Island Sound, Connecticut-New York. In: L.J. Poppe and C. Polloni (eds.), Long Island Sound Environmental Studies: U.S. Geological Survey Open-File Report 98-502, CD-ROM.
Knebel, H.J.; Signell, R.P.; Rendigs, R.R.; Poppe, L.J., and List, J.H., 1999, Seafloor environments in the Long Island Sound estuarine system: Marine Geology, v. 155, p. 277-318.
Lucena, F., Araujo, R., and Jofre, J., 1996, Usefulness of bacteriophages infecting Bacteriodes fragilis as index microorganisms of remote fecal pollution: Water Research, v. 30, p. 2812-2816.
Matches, J.R., Liston, J., and Curren, D., 1974, Clostridium perfringens in the environment: Applied Microbiology, v. 28, p. 655-660.
Mecray, E.L. and Buchholtz ten Brink, M.R., 2000, Contaminant distribution and accumulation in the surface sediments of Long Island Sound. Thematic section: Journal of Coastal Research, in press.
Mecray, E.L.; Buchholtz ten Brink, M.R; and Shah, S., 2000, Metal distributions in the surface sediments of Long Island Sound.: U.S. Geological Survey Open-File Report, this CD-ROM.
Murray, R.W. and Leinen, M., 1996, Scavenged excess Al and its relationship to bulk Ti in biogenic sediment from the central equatorial Pacific Ocean: Geochimica et Cosmochimica Acta, v. 60, p. 3869-3878.
NOAA (National Oceanic and Atmospheric Administration), 1999, National Ocean Service Estuarine Bathymetry. Online at SPOserver.nos.noaa.gov/bathy/.
NRC (National Research Council), 1993, Managing Wastewater in Coastal Urban Environments, Washington, D.C.: National Academy of Sciences, 477 p.
Parmenter, C. and Bothner, M., 1993, The distribution of Clostridium perfringens, a sewage indicator, in sediments of coastal Massachusetts: U.S. Geological Survey Open-File Report 93-8, 45 p.
Poppe, L.J. and Polloni, C., (eds.), 1998, Long Island Sound Environmental Studies: U.S. Geological Survey Open-File Report 98-502, 1 CD-ROM.
Poppe, L.J., Eliason, A.H., and Fredericks, J.J., 1985, APSAS - An automated particle size analysis system: U.S. Geological Survey Circular 963, 77 p.
Poppe, L.J., Hastings, M.E., DiGiacomo-Cohen, M.L., Manheim, F.T., and Mlodzinska, Z.J., 1998, Surficial sediment database. In: L.J. Poppe and C. Polloni (eds.), Long Island Sound Environmental Studies: U.S. Geological Survey Open-File Report 98-502, 1 CD-ROM.
Rippey, S.R. and Watkins, W.D., 1992, Comparative rates of disinfection of microbial indicator organisms in chlorinated sewage effluents: Water Science and Technology, v. 26, p. 2185-2189.
Sawyer, T.K., Nerad, T.A., Gaines, J., Small, E.B., and Cooper, R.A., 1996, Bacterial and protozoan indicators of sewage contamination of deep water sediments at Hudson Canyon: Journal of Marine and Environmental Engineering, v. 2, p. 369-376.
Shanavis, C., 1998, Suitable indicators for the presence of sewage sludge in marine sediments: In: The 1998 Oceans Conference Part 3. Piscataway, New Jersey: IEEE, pp. 1844-1853.
U.S. Census Bureau, 1999, United States Census Data Browser: Recent census data files. Online at www.census.gov/population/www/.
U.S. EPA (U.S. Environmental Protection Agency), 1994, The Long Island Sound Study: Summary of the Comprehensive Conservation and Management Plan: EPA 842-S-94-001, 62 p.
U.S. EPA, 1995, Method for detection and enumeration of Clostridium perfringens in water and sediments by membrane filtration: U.S. Environmental Protection Agency Office of Research and Development Report EPA/600/R 95/03, 14 p.
U.S. EPA, 1997, Incidence and severity of sediment contamination in the surface waters of the United States. Vol. 1, National Sediment Quality Survey; Vol. 2, Data summaries for watersheds containing areas of probable concern; Vol. 3, National sediment contaminant point source category. U.S. Environmental Protection Agency Reports EPA 823/R-97-006, 007, and 008. Online at www.epa.gov/OST/cs/congress.html.
U.S. EPA, 2000, National Pollutant Discharge Elimination System (NPDES). Online at www.epa.gov/owm/gen2.htm and www.epa.gov/enviro/html/pcs/pcs_overview.html.
Valente, R.M., Rhoades, D.C., Germano, J.D., and Cabelli, V.J., 1992, Mapping of benthic enrichment in Narragansett Bay, Rhode Island: Estuaries, v. 15, p. 1-17.
Varekamp, J.C. and Scholand, S.J., 1996, Metal pollution in coastal and riverine wetlands. In: The 3rd Biennial Long Island Sound Research Conference, pp. 95-100.
Varekamp, J.C.; Buchholtz ten Brink, M.R., Mecray, E.L., and Kreulen, B., 2000, Mercury in Long Island Sound sediments: Thematic section. Journal of Coastal Research. in press.
Watkins, W.D. and Burkhardt, W., III, 1996, New microbial approaches
for assessing and indexing contamination and loading in estuaries and marine
waters. In: F.J. Vernberg; W.B. Vernberg, and T. Siewicki (eds.), Sustainable
Development in the Southeastern Coastal Zone 20. Myrtle Beach, South Carolina:
University of South Carolina Press, pp. 241-263.
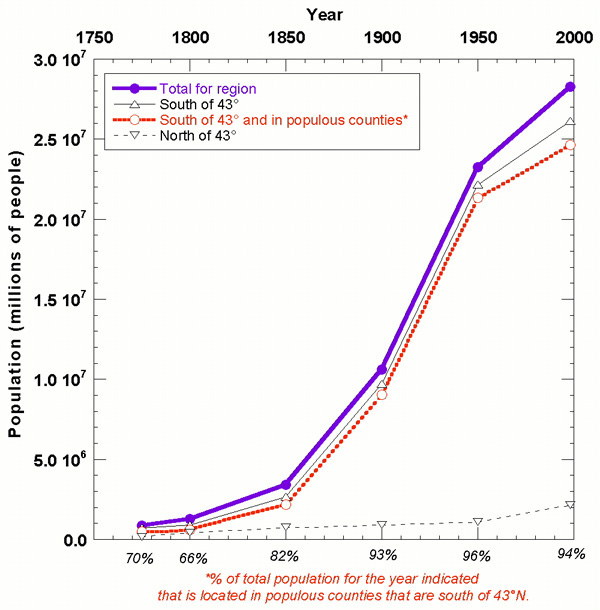
Figure 1b. Integrated population growth for counties located in watersheds that drain to Long Island Sound. The population that is nearest to Long Island Sound (south of 43°N) and dwelling in populous counties (those having >200,000 people in 1998) is more likely to provide a source of sewage contamination to the Sound than more distant or rural centers.
Figure 2. Scanning electron microscopy image of three Clostridium perfringens bacteria in a matrix of fine sediment particles from the A1 sediment core (0-0.5 cm core depth).
Figure 3. Locations where sediment cores were collected in June, 1996 in Long Island Sound on the R/V Seaward Explorer. Transects A through L are shown with the station numbers (e.g., A1, A2, A31/4). Figure 4a shows the locations of grab samples that complemented the core distribution. Latitude and longitude of cores are in Table 1. Bathymetry is from NOAA (1999).
Figure 4a. Map of the location and concentration of Clostridium perfringens spores in surface sediment samples (0-2 cm). Higher concentrations are given as larger dots and darker colors. Lines delineate the sedimentary environments (Knebel and others, 1999; see Knebel and Poppe, 2000) of deposition, reworking, transport and erosion. Latitude, longitude, and Clostridium perfringens concentration of grab samples are in Buchholtz ten Brink and Mecray (1998), Mecray and others, this CD-ROM, and Table 2.
Figure 4b. Concentration map for Clostridium perfringens distribution in Long Island Sound sediments. Data was contoured from surface sediment measurements (Figure 4a) using the triangulation interpolation (TIN) technique.
Figure 4c. Contour map of Clostridium perfringens concentration normalized to the percent of fine-grained sediment for each surface sample. Individual samples are shown as points and shading gives TIN interpolated values.
Figure 5. Profiles of Clostridium perfringens concentrations in cores shown with the bathymetry and location of each core along the N-S trending transects. From west to east, these are Transects (5a,5b, 5c) A, M and B; (5d, 5e, 5f) C, D, and E; (5g, 5h, 5i) F, G, and H; and (5j, 5k, 5l, 5m) I, J, K, and L. Locations of transects and cores are in Figure 3 and Table 1. Maximum error bars (often within the symbol size) of ±25% are shown for Clostridium perfringens concentrations. Plotted sample depth in the sediment is ± 0.25 cm for cores sampled at 0.5-cm depth intervals, and ±1 cm depth for frozen cores that were sectioned in 2-cm intervals. Open symbols indicate samples measured as less than the detection limit, which is the value plotted. The dashed line indicates a representative, pre-contaminant background value. Depth and concentration scales are the same for all cores. Concentrations are shown on a log scale to allow comparison of values that range across three orders of magnitude. Data are given in Tables 3a, 3b, and 3c.
Figure 6. Water content (as weight
fraction, i.e. g water/g wet sediment) profiles and x-radiographs of selected
cores: (a-b) G1C1, (c) C1C2, and (d-e) C5C1. Cores G1C1 and C1C2
are muddy with interspersed sand, gravel, or shell deposits.
Table 2. Latitude, longitude, and Clostridium perfringens concentration for grab samples in Microsoft Excel. A copy of this table (c8t2gra.xls) may also be downloaded in Microsoft Excel format.
Tables 3a, 3b, and 3c). Clostridium perfringens concentration for core samples, shown by transect in Microsoft Excel. Copies of these tables (c8t3acor.xls, c8t3bcor.xls , c8t3ccor.xls ) may also be downloaded in Microsoft Excel format.