|
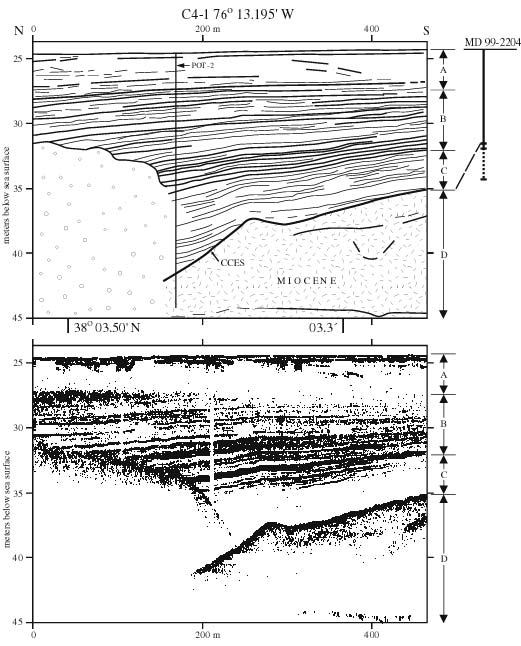
Figure 3.2. Chirp sonar (2-15 kHz) profile segment C4-1 (Fig. 3.1) and, at top, geological interpretation. POT-2 was planned core site, with actual core MD99-2204 core taken somewhat outside this profile, as shown at right. Dotted lower extension of bar shows sediment penetrated but not recovered. Main seismoacoustic units are A, acoustically transparent unit; B, acoustically laminated unit; C, weakly laminated unit; and D, Miocene "basement" unit. Heavy line separating C and D is the Cape Charles erosion surface(CCES) of Colman and Halka (1988). Zone of methane bubbles indicated schematically by open circle pattern: however, vertical extent of gas cannot be determined from acoustic data shown. Weaker or intermittent reflectors shown by thinner or dashed lines. |
TO RETURN TO REPORT, CLOSE THIS WINDOW.
U.S. Department of Interior, U.S. Geological Survey
URL of this page: https://pubs.usgs.gov/openfile/of00-306/chapter3/fig3-2.html
Maintained by: Eastern Publications Group Web Team
Last modified: 03.28.01 (krw)