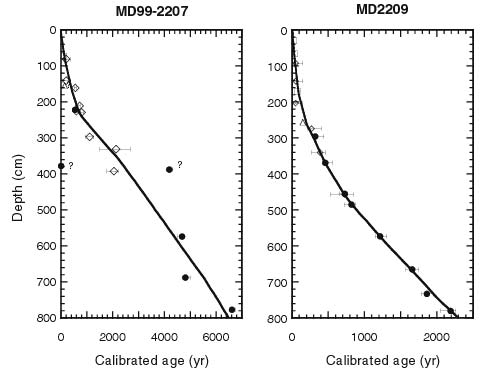
| Figure 6.2. Plot of age against depth for the upper 800 cm of MD99-2207 and -2209, showing major change in mass accumulation rate in the upper part of the section at each core site. Symbols as in Figure 6.1. |
TO RETURN TO REPORT, CLOSE THIS WINDOW.
U.S. Department of Interior, U.S. Geological Survey
URL of this page: https://pubs.usgs.gov/openfile/of00-306/chapter6/fig6-2.html
Maintained by: Eastern Publications Group Web Team
Last modified: 03.29.01 (krw)