Department of Geology and Geophysics
University of Minnesota
310 Pillsbury Drive
Minneapolis, MN 55455
Telephone: (612) 626-0505
Fax: (612) 625-3819
e-mail: lpaul@umn.edu
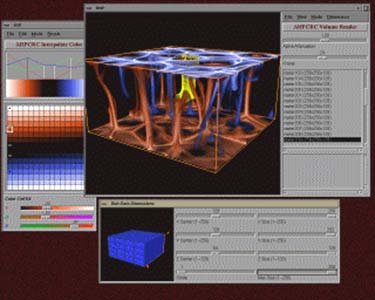
Figure 1. A screenshot of a mantle convection simulation using BOB. |
The primary issue that BOB addressed was large 3D datasets, as shown in figure 1. Many of the animations that used BOB had several thousand timesteps that were individually larger than 512x512x512 bytes with total a total size of over 100 gigabytes. BOB's advantage was that it was written as a simple turnkey program that gave users access to their data in minutes. Though BOB was written nearly 10 years ago many variants of it are still being used.
With recent graphics hardware advances, modern scientific visualization is being driven to the desktop and into the hands of more users. What once required a mid-range graphics workstation can now be performed on a consumer grade Windows PC. The primary factor we have to thank for this drop in price is the computer game industry and most notably the first-person shoot-em-up games, such as Doom.
Table 1 contains a comparison of three very different graphics platforms. The Onyx 2 is the computer of choice for high-end visualization and virtual reality. It is available in a desk side version that is about half the size of a desk or in a format the size and shape of a refrigerator. The PC is a standard Intel/Windows computer with a high-end consumer graphics board. The Sony Playstation 2 is the newest generation of home video game computers.
Table 1. Comparison of three types of computers with powerful graphics subsystems.
| SGI Onyx 2 with Infinite Reality Graphics | High end PC with a Asus 6800 Graphics Card | Sony Playstation 2 | |
| CPU | 250 MHz + | 1 GHz | 300 MHz |
| RAM | Up to 16 gigabytes | Gigabyte + | 32 MB |
| Max Polygon Rate | 10 Million per pipeline/sec | 7 Million/sec | 20 Million/sec |
| Stereo Images | Yes | Yes | No |
| Communication | Any | Any | PCMCIA Card |
| Weight | 400 lbs. | 20 lbs. | Under 5 lbs. |
| Cost | $50,000-Million+ | Less than $4000 | $300-$400 |
A few items in Table 1 are worth noting. Even though the Onyx 2 has CPU clock speeds that are well below those manufactured by Intel, they are still faster in floating point calculations because they are primarily designed for use in science and engineering. The Sony Playstation 2 and the Windows PC have significantly smaller memory capacity and, more importantly, the speed that the CPU can access the memory is more than an order of magnitude slower than the Onyx 2.
Probably the most interesting benchmark is the maximum polygon rate of each of the graphics subsystems. This is a relatively new development for the increasingly low-cost systems to rival the performance of high-end systems. The maximum polygon rate is a significant measure, as polygons comprise almost every object observed within a 3D scene. If more polygons are pushed to the screen, objects can be more elaborate and responsive when being manipulated by a user. Moreover, these statistics are for texture mapped polygons. That is, polygons that have been painted with a raster image. The ramifications of texture mapping for practitioners of digital mapping is very important. It is the simplest way to texture map a DEM with any geo-referenced raster data.
It is worth noting that the Macintosh series of computers are rarely used in 3D scientific visualization. The primary reason is that, until recently, Apple has not opened the Macintosh platform to third party graphics boards that support 3D graphics standards, such as OGL.
|
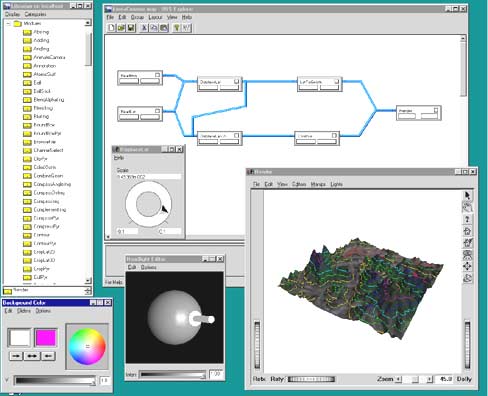
Figure 2. A remote sensing image painted on a DEM using Iris Explorer on Windows NT. Note the modules in the flowchart-like interface. |
All three visualization packages are used in a very similar way. Users create a flow chart within a sophisticated graphical user interface, consisting of modules connected by paths that direct the flow of data. This "data flow" model for constructing visualizations is very quick and powerful, but it has one primary drawback. It makes many copies of data and requires a large amount of RAM and hard disk space to run. It is common to have hundreds of megabytes of RAM on any machine running these programs. The advantage of using this data flow model is that modules can be quickly rearranged, added, written, and adapted without knowing the entire system.
A CAVE consists of a large graphics workstation, which displays stereo images in a 10'x10'x10' room with up to four walls, the floor, and ceiling (Fig. 3). A small number of users (usually under 3) can walk within the objects being displayed, giving a sense of immersion.
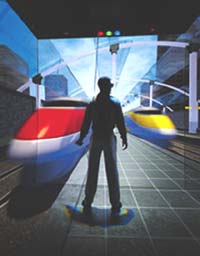
Figure 3a. A user in a CAVE (figure courtesy Fakespace Systems, Inc.). |
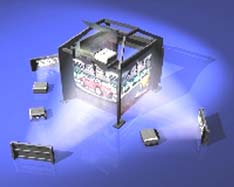
Figure 3b. A schematic of the exterior of a four walled CAVE (figure courtesy Fakespace Systems, Inc.). |
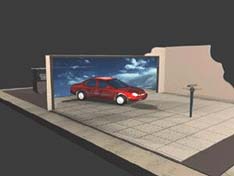 Figure 4. An artist's conception of a WorkWall (figure courtesy Fakespace Systems, Inc.)
|
CAVEs are expensive. A full 6-sided CAVE with a powerful SGI workstation can exceed one million dollars including the projectors, computer, screen, and software. Interestingly, the barrier to lowering the cost of this technology is not the cost of the computers, but the cost of the projectors. The most inexpensive projector that supports stereo images is $20,000. Also, the usefulness of a multi-wall CAVE is limited to a small number of people that can crowd around the user with the position sensor on his stereo goggles. An alternative is a single wall CAVE, also called a WorkWall (Fig. 4). This configuration uses less expensive hardware and gives a larger group of people more of a shared experience. WorkWalls are finding their way into design labs and classrooms for just this reason.
Another lower cost alternative is to use one of the new breed of stereo boards designed for the Advanced Graphics Interface (AGI) slot in a Windows PC. Boards such as the Asus 6800 and Elsa Erazor X cost less than $350 with stereo goggles. The Geology and Geophysics Department of the University of Minnesota is exploring installing these graphics boards in every PC in the physical geology lab rooms. Students will add the exploration of earthquake hypocenters and topography in 3D to traditional labs on mineral identification and map reading.
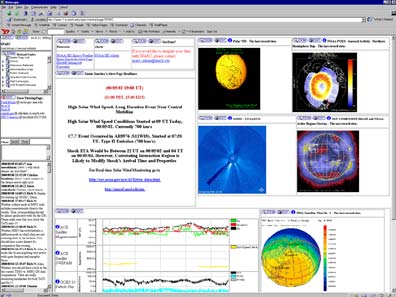
Figure 5. The SPARC opening page. Any of the pages can be customized to show
any one of numerous data sources.
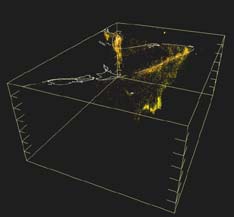
Figure 6. A VRML file of earthquake hypocenters beneath Tonga. |
The next generation of Internet delivery of visualization currently under development will allow users to construct visualizations from scratch using data sources distributed around the Internet and delivered as GIF images, QuickTime movies, and Virtual Reality Markup Language (VRML) objects (Fig. 6) using the CosmoPlayer plugin by Computer Associates International or the 3SpaceAssistant application and plugin from Template Graphics Software, Inc. The aim is to remove most, if not all, of the visualization software from the user's computer and to produce visualizations from data anywhere on the Internet. This frees the user from installing large numbers of plug-ins or downloading large JAVA applets that don't work. It also keeps the complex visualization software at a central site where it can be maintained and updated easily. The SPARC system could be applied to the real time display of stream flow data. As data is downloaded from data loggers in the field, visualizations could be created and pushed to a display that has been custom described by the user. A second possible application takes advantage of SPARC's infrastructure for historical databases. Paleoclimate data can be included in SPARC along with their metadata, allowing users to construct maps in any area of the world, using a number of available proxies or models.
CAVE Guide -- http://www.evl.uic.edu/pape/CAVE/prog/CAVEGuide.html.
Fakespace Systems Inc. -- 809 Wellington St., N., Kitchener, ON, Canada, N2G 4J6, (519) 749-3339, http://www.fakespacesystems.com/.
3D on the Web
Web3D Consortium -- http://www.web3d.org/.
CosmoPlayer -- Computer Associates International, Inc., One Computer Associates Plaza, Islandia, NY 11749, (631) 342-5224, http://www.cosmosoftware.com/.
3SpaceAssistant -- Template Graphics Software, Inc., http://www.tgs.com/.
Space Physics and Aeronomy Research Collaboratory (SPARC) -- http://intel.si.umich.edu/SPARC/.
Brick of Bytes (BOB) -- http://www.arc.umn.edu/gvl-software/bob.html.
Generic Scientific Visualization Packages
Iris Explorer -- NAG LTD, Wilkinson House, Jordan Hill Road, OXFORD, OX2 8DR, UK, +44 1865 511245, http://www.nag.com/Welcome_IEC.html.
Advanced Visual Systems,Inc., 300 Fifth Avenue, Waltham, MA 02451, 781-890-4300, http://www.avs.com/.
IBM Open Data Explorer -- http://www.research.ibm.com/dx/.
Stereo Hardware and Software
Stereo3D.com -- http://www.stereo3d.com/.
Hardware
Silicon Graphics, Inc., 1600 Amphitheatre Parkway, Mountain View, CA 94043, (650) 960-1980, http://www.sgi.com/.
Asus, Inc., 150 Li-Te Road, Peitou, Taipei, Taiwan 112 R.O.C., +886-2-2894-3447, http://www.asus.com/.
Elsa Erazor X -- Elsa, Inc., 1630 Zanker Rd., San Jose, CA 95112, (408) 961-4600, http://www.elsa.com/.