
U.S. Geological Survey Open-File Report 00-415
A Microsoft Windows Version of the MARK3
Monte Carlo Resource Simulator
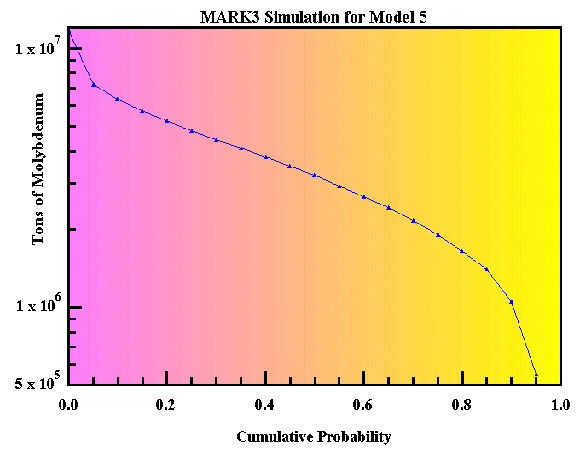
Known Program Bugs and Program Download FIGURES: Figure showing probability curve for tons of ore.
This figure shows the plot of simulation results for tons of molybdenum using the information shown as an example of MARK3 program output. Click on the entry at the left to see that output.
U.S. Department of the Interior, U..S. Geological Survey
This page is https://pubs.usgs.gov/openfile/of00-415/figure1.htm
Contact: jduval@usgs.gov
Last modification: 02/21/2001 (jmw)