![]()
![]()
New Mexico Bouguer Gravity Anomaly Map
![]()
Northwest Illumination
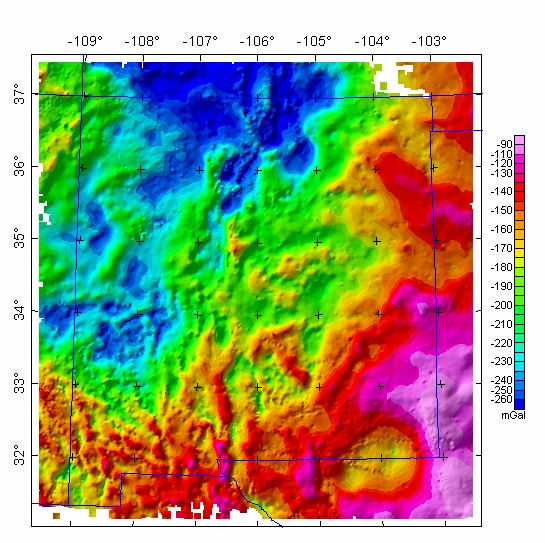
The colors on this Bouguer gravity anomaly map represent gravity variations resulting from lateral density variations in the Earth. Positive anomalies (red colors) occur in areas with average density greater than the Bouguer reduction density of 2.67 gm/cc, whereas negative anomalies (blue colors) occur in areas of lower density.
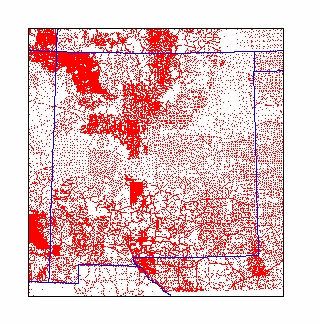
The complete-Bouguer gravity anomaly grid was generated from 42,786 gravity station measurements in and adjacent to the state of New Mexico. These data were extracted from the gravity data base maintained by the National Geophysical Data Center (from Department of Defense unclassified data) (Hittleman and others, 1994) and augmented with data from the USGS and from several university theses and dissertations. Observed gravity measurements relative to the IGSN-71 datum were reduced to the Bouguer anomaly using the 1967 gravity formula (Cordell and others, 1982) and a reduction density of 2.67 gm/cc. Terrain corrections were calculated radially outward from each station to a distance of 167 km using a method developed by Plouff (1977). The data were converted to a 1-km grid using minimum curvature techniques. This compilation does not include unpublished data or a recent regional compilation in Central New Mexico (Gillespie and others, 2000)
Grids for this map in various formats are available from the data directory as grvcba.***
Contact co-author Chuck Heywood for further information concerning gravity data and reduction.
Top || New Mexico Mag || Crustal Team || Geology || USGS