Open-File Report 02-227
The NURE HSSR samples were collected and processed using a variety of protocols, with minor variations in sieve size, whether samples were sieved wet or dry, whether they were from active streams, and other differences. NURE sample types within our dataset include the following:
All samples collected in the 1990's, under the Malheur-Jordan-Andrews and Winnemucca-Surprise mineral resource assessments, were stream sediments and are designated as sample type 100. These samples were probably prepared from bulk and sieved to -80 mesh. Samples designated as type 102 are NURE-collected stream sediments that were sieved at -80 mesh and analyzed under the Humboldt River basin mineral resource assessment. Due to their consistency in media type, these samples are not discussed here.
All NURE sample type descriptions are tabulated at the online Manual for Interpreting New- Format NURE HSSR Data Files.
We were particularly concerned by the so-called soil samples (sample type 59, primarily in the Elko, McDermitt, and Wells quadrangles), which apparently were not collected from active or dry streambeds. We have examined our data to see if the type of sample exerts any systematic controls on composition, and see no reason to avoid mixing results from these different sample media. Figure 3 (below) shows a comparison, for each element in the dataset, of the mean value for soil and stream-sediment samples (types 50, 61, 66, 70, and 72). Figure 4 (below) shows an east-west profile across the dataset for As (the element in Figure 3 with the poorest correspondence) at latitude 41.6±0.2 degrees north. On each plot there is no important discrepancy between the soil and stream-sediment samples.
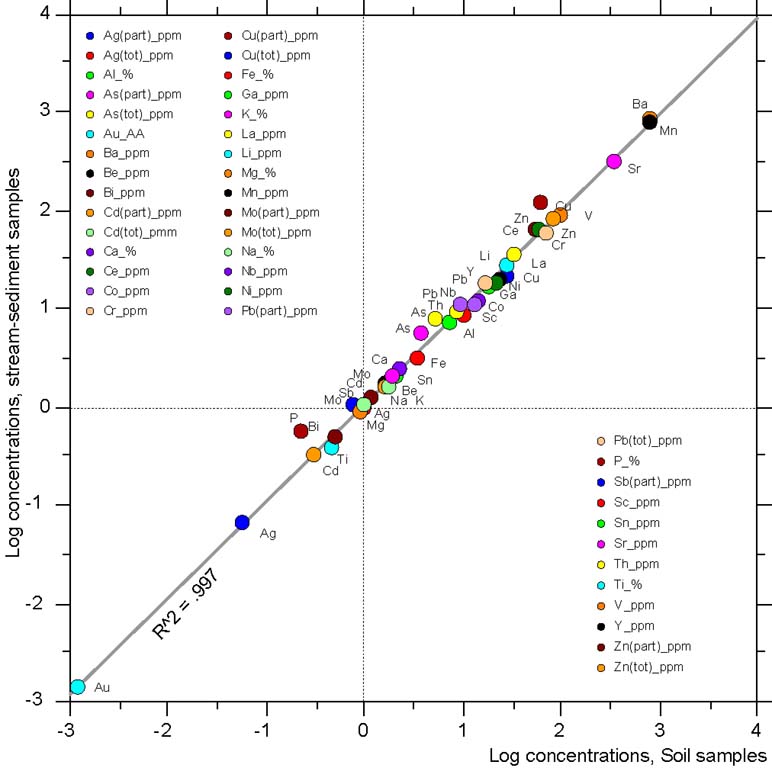
Figure 3.-Scattergram for each element in the dataset, showing concentration in stream-sediment samples compared to concentration in soil samples. (Click on the figure above to download a high-quality version (149 KB) of this figure in Adobe Illustrator format.)

Figure 4.-East-west profile for As (partial) at latitude 41.6±0.2 degrees north. (Click on the figure above to open a high-quality (300 dpi) version of this figure in JPEG format.)
Geochemists have recognized for a long time that there are variations in analyses done by different methods, analysts, and laboratories. The purpose of this section is to discuss the results of standard reference material (SRM) analyses and to provide insight into the quality and limitations of the data from the Winnemucca-Surprise (King and others, 1996), Malheur-Jordan-Andrews (Carlson and Lee, in press), and Humboldt River basin (Folger, 2000) mineral and environmental resource assessment studies.
In order to evaluate the quality of the data received from the laboratories, SRM were submitted with the stream-sediment and soil samples. The SRM used during these regional studies is a San Joaquin soil (NIST 2709) that was characterized by the National Institute of Standards and Technology. The samples and SRM were analyzed concurrently by two standard geochemical methods:
The results of SRM were handled in two ways. The standards submitted by the U.S. Geological Survey (USGS) in the Winnemucca-Surprise (WS) and Malheur-Jordan-Andrews (MJA) studies were used by the USGS to calibrate the subsequent analyses of unknowns. Standards submitted in the Humboldt River basin (HRB) study were unknown to the analyst and laboratory (double blind). These standards were not used to calibrate but instead were used to monitor the accuracy, and therefore the quality, of the analysis.
For all three studies, the standards were run concurrent to the analyses of the stream-sediment and soil samples. There were 37 standard samples analyzed for the HRB study, approximately one per one hundred stream-sediment or soil samples. For the WS and the MJA surveys, the USGS routinely used one standard sample per 20 stream-sediment samples as part of a suite of standards used to calibrate the ICP-AES.
The results of the analysis of standard reference material NIST 2709 are summarized in tables 3 and 4 (below). The following paragraphs contain definitions of some of the terms used to describe the analyses.
Certified values (Certified) are considered the "true" values and are published by the National Institute of Standards. Not all elements have certified values; however, the USGS has used an estimated concentration based on results of multiple analyses instead. These USGS values are referred to here as "suggested" values. The mean/certified ratio (Mean/Cert.) estimates the degree to which the SRM values approach the "true" values. This ratio quantifies the accuracy of the analyses. Values below 1 underestimate and values over 1 overestimate the "true," or certified, value.
Detection ratio (D.R.) represents the ratio of valid results (values that fall above the lower limit of detection) to the total number of standards analyzed. Lower limit of detection (LLD) refers to the lower limit of detection for each element analyzed. The LLD is defined as the lowest concentration level that can be determined to be statistically different from a blank. The International Union of Pure and Applied Chemistry defined this to be 3 standard deviations for a 99-percent confidence level (Arbogast, 1990). In some instances the laboratory reported values below their published limit of detection. These values are instrument readings for which the reliability and reproducibility have greater uncertainty.
Table 3.-Statistical summary of the analytical results of SRM NIST 2709 run concurrently with analyses of stream-sediment and soil samples for the Humboldt River basin study (Folger, 2000). The relative standard deviation (%RSD) is the ratio of standard deviation (Std. Dev.) to the mean expressed in percent. The detection ratio (D.R.) represents the ratio of valid results (values that fall above the lower limit of detection) to the total number of standards analyzed. LLD refers to the lower limit of detection for each element analyzed. The element suffix "tot" refers to analysis by total digestion methods, and the element suffix "part" refers to analysis by partial digestion methods. A total of 37 standards were analyzed. (CLICK HERE to download this file (48 KB) in Microsoft Excel format.)
| Element | Mean | Median | Minimum | Maximum | Std. Dev. | %RSD | Certified | Mean/Cert. | D.R. | LLD |
| Ag(tot)_ppm | NA | 0.6 | 0.4 | 1.2 | NA | NA | 0.41 | NA | 0.41 | 0.5 |
| Ag(part)_ppm | 0.406 | 0.405 | 0.354 | 0.457 | 0.02 | 5.55 | 0.41 | 0.99 | 1 | 0.015 |
| Al_% | 7.214 | 7.2 | 6.76 | 7.89 | 0.26 | 3.67 | 7.5 | 0.96 | 1 | 0.01 |
| As(tot)_ppm | 16.30 | 16 | 6 | 28 | 5.07 | 31.09 | 17.7 | 0.92 | 1 | 5 |
| As(part)_ppm | 15.374 | 15.25 | 13.3 | 18.2 | 1.01 | 6.55 | 17.7 | 0.87 | 1 | 1 |
| Au_AA | 0.254 | 0.248 | 0.193 | 0.345 | 0.04 | 15.46 | 0.3 | 0.85 | 1 | 0.0005 |
| Ba_ppm | 903.35 | 895 | 837 | 1022 | 40.37 | 4.47 | 968 | 0.93 | 1 | 1 |
| Be_ppm | 3.19 | 3 | 2 | 4 | 0.56 | 17.61 | NA | NA | 1 | 1 |
| Bi(part)_ppm | 0.424 | 0.432 | 0.332 | 0.519 | 0.05 | 10.96 | NA | NA | 1 | 0.25 |
| Ca_% | 1.865 | 1.87 | 1.69 | 2.01 | 0.08 | 4.40 | 1.89 | 0.99 | 1 | 0.01 |
| Cd(tot)_ppm | 0.64 | 0.60 | 0.40 | 1.00 | 0.15 | 23.75 | 0.38 | 1.69 | 0.73 | 0.40 |
| Cd(part)_ppm | 0.368 | 0.3635 | 0.331 | 0.492 | 0.03 | 7.96 | 0.38 | 0.97 | 1 | 0.1 |
| Ce_ppm | 39.49 | 40 | 33 | 47 | 3.76 | 9.52 | 42 | 0.94 | 1 | 1 |
| Co_ppm | 12.08 | 12 | 11 | 16 | 1.30 | 10.78 | 13.4 | 0.90 | 1 | 2 |
| Cr_ppm | 97.24 | 99 | 68 | 110 | 10.73 | 11.04 | 130 | 0.75 | 1 | 2 |
| Cu(tot)_ppm | 31.81 | 32 | 29 | 34 | 1.41 | 4.44 | 34.6 | 0.92 | 1 | 2 |
| Cu(part)_ppm | 32.439 | 32.3 | 29.9 | 38.9 | 1.72 | 5.31 | 34.6 | 0.94 | 1 | 0.05 |
| Fe_% | 3.47 | 3.46 | 3.13 | 3.82 | 0.18 | 5.11 | 3.5 | 0.99 | 1 | 0.01 |
| Ga_ppm | 15.11 | 15 | 12 | 19 | 1.57 | 10.41 | 14 | 1.08 | 1 | 1 |
| K_% | 1.916 | 1.92 | 1.73 | 2.06 | 0.07 | 3.81 | 2.03 | 0.94 | 1 | 0.01 |
| La_ppm | 23.86 | 24 | 19 | 31 | 2.27 | 9.50 | 23 | 1.04 | 1 | 2 |
| Li_ppm | 44.03 | 45 | 33 | 58 | 5.93 | 13.46 | 52 | 0.85 | 1 | 1 |
| Mg_% | 1.466 | 1.47 | 1.29 | 1.61 | 0.07 | 5.09 | 1.51 | 0.97 | 1 | 0.01 |
| Mn_ppm | 528.38 | 526 | 481 | 574 | 23.74 | 4.49 | 538 | 0.98 | 1 | 5 |
| Mo(tot)_ppm | NA | 3 | 2 | 5 | NA | NA | 2 | NA | 0.43 | 2 |
| Mo(part)_ppm | 1.757 | 1.76 | 1.5 | 2.16 | 0.14 | 8.01 | 2 | 0.88 | 1 | 0.1 |
| Na_% | 1.116 | 1.11 | 1.01 | 1.2 | 0.04 | 3.63 | 1.16 | 0.96 | 1 | 0.01 |
| Nb_ppm | 6.02 | 6 | 3.7 | 8 | 0.90 | 15.03 | 9 | 0.67 | 1 | 2 |
| Ni_ppm | 78.95 | 79 | 72 | 85 | 3.31 | 4.20 | 88 | 0.90 | 1 | 2 |
| P_% | 0.063 | 0.063 | 0.055 | 0.07 | 0.00 | 5.80 | 0.062 | 1.01 | 1 | 0.002 |
| Pb(tot)_ppm | 18.08 | 18.5 | 5 | 34 | 5.27 | 29.16 | 18.9 | 0.96 | 0.97 | 5 |
| Pb(part)_ppm | 12.921 | 12.85 | 11.4 | 18 | 1.10 | 8.52 | 18.9 | 0.68 | 1 | 0.25 |
| Sb(part)_ppm | 5.295 | 5.21 | 4.37 | 6.42 | 0.554 | 10.471 | 7.9 | 0.67 | 1 | 0.25 |
| Sc_ppm | 8.62 | 9 | 7 | 10 | 0.63 | 7.31 | 12 | 0.72 | 1 | 1 |
| Sn_ppm | NA | 2 | 2 | 3 | NA | NA | NA | NA | 0.51 | 2 |
| Sr_ppm | 218.16 | 217 | 205 | 233 | 8.07 | 3.70 | 231 | 0.94 | 1 | 2 |
| Th_ppm | 9.78 | 9 | 7 | 12 | 1.25 | 12.83 | 11 | 0.89 | 1 | 2 |
| Ti_% | 0.308 | 0.31 | 0.28 | 0.33 | 0.01 | 4.05 | 0.342 | 0.90 | 1 | 0.01 |
| V_ppm | 107.86 | 109 | 100 | 116 | 4.26 | 3.95 | 112 | 0.96 | 1 | 2 |
| Y_ppm | 14.30 | 13 | 10 | 18 | 2.37 | 16.57 | 18 | 0.79 | 1 | 2 |
| Zn(tot)_ppm | 93.70 | 93 | 83 | 117 | 6.23 | 6.65 | 106 | 0.88 | 1 | 2 |
| Zn(part)_ppm | 92.621 | 91.55 | 84.8 | 124 | 7.01 | 7.57 | 106 | 0.87 | 1 | 1 |
Table 4.-Statistical summary of the analytical results of SRM NIST 2709 run concurrently with analyses of stream-sediment and soil samples for the Winnemucca-Surprise and Malheur-Jordan-Andrews mineral-resource assessments (Carlson and Lee, in press; King and others, 1996). The relative standard deviation (%RSD) is the ratio of standard deviation (Std. Dev.) to the mean expressed in percent. The detection ratio (D.R.) represents the ratio of valid results (values that fall above the lower limit of detection) to the total number of standards analyzed. LLD refers to the lower limit of detection for each element analyzed. The element suffix "tot" refers to analysis by total digestion methods. A total of 108 standards were analyzed. No quality assurance or quality control data were available for Ag(tot), Mo(tot), and Sn.(CLICK HERE to download this file (42 KB) in Microsoft Excel format.)
| Element | Mean | Median | Minimum | Maximum | Std. Dev. | %RSD | Certified | Mean/Cert. | D.R. | LLD |
| Al_% | 7.39 | 7.39 | 7.15 | 7.66 | 0.09 | 1.26 | 7.5 | 0.98 | 1 | 0.005 |
| As(tot)_ppm | 16.58 | 16.42 | 11.00 | 22.72 | 2.61 | 15.73 | 17.7 | 0.94 | 1 | 10 |
| Ba_ppm | 930.40 | 929.44 | 891.29 | 981.11 | 17.56 | 1.89 | 968 | 0.96 | 1 | 2 |
| Be_ppm | 3.94 | 3.99 | 3.02 | 4.64 | 0.32 | 8.08 | 4 | 0.99 | 1 | 2 |
| Ca_% | 1.95 | 1.95 | 1.87 | 2.01 | 0.02 | 1.28 | 1.89 | 1.03 | 1 | 0.005 |
| Cd(tot)_ppm | 0.22 | 0.17 | 0.56 | 1.35 | 0.46 | 206.74 | 0.38 | 0.58 | 0.64 | 2 |
| Ce_ppm | 42.74 | 42.92 | 36.65 | 48.86 | 2.40 | 5.62 | 42 | 1.02 | 1 | 4 |
| Co_ppm | 14.37 | 14.38 | 13.14 | 15.92 | 0.51 | 3.55 | 13.4 | 1.07 | 1 | 4 |
| Cr_ppm | 126.25 | 125.98 | 114.49 | 136.08 | 4.43 | 3.51 | 130 | 0.97 | 1 | 2 |
| Cu(tot)_ppm | 33.10 | 32.92 | 30.33 | 39.31 | 1.43 | 4.31 | 34.6 | 0.96 | 1 | 2 |
| Fe_% | 3.71 | 3.70 | 3.48 | 4.04 | 0.11 | 3.07 | 3.5 | 1.06 | 1 | 0.005 |
| Ga_ppm | 15.87 | 15.84 | 14.25 | 17.81 | 0.60 | 3.76 | 14 | 1.13 | 1 | 4 |
| K_% | 1.98 | 1.98 | 1.92 | 2.05 | 0.03 | 1.45 | 2.03 | 0.98 | 1 | 0.01 |
| La_ppm | 23.92 | 24.03 | 21.58 | 25.49 | 0.85 | 3.55 | 23 | 1.04 | 1 | 2 |
| Li_ppm | 55.43 | 55.67 | 48.88 | 59.28 | 1.71 | 3.09 | 55 | 1.01 | 1 | 2 |
| Mg_% | 1.53 | 1.53 | 1.43 | 1.59 | 0.03 | 1.68 | 1.51 | 1.01 | 1 | 0.005 |
| Mn_ppm | 548.86 | 548.30 | 526.86 | 576.38 | 8.70 | 1.59 | 538 | 1.02 | 1 | 4 |
| Na_% | 1.51 | 1.49 | 1.29 | 2.07 | 0.14 | 9.22 | 1.16 | 1.30 | 1 | 0.005 |
| Nb_ppm | 12.67 | 12.80 | 6.78 | 15.62 | 1.80 | 14.19 | NA | NA | 1 | 2 |
| Ni_ppm | 83.33 | 83.18 | 76.47 | 88.70 | 1.87 | 2.25 | 88 | 0.95 | 1 | 2 |
| P_% | 0.07 | 0.07 | 0.06 | 0.07 | 0.00 | 2.06 | 0.06 | 1.11 | 1 | 0.005 |
| Pb(tot)_ppm | 17.44 | 17.38 | 13.78 | 22.29 | 1.78 | 10.21 | 18 | 0.97 | 1 | 4 |
| Sc_ppm | 11.90 | 11.90 | 11.05 | 12.43 | 0.19 | 1.61 | 12 | 0.99 | 1 | 2 |
| Sr_ppm | 234.58 | 234.24 | 228.84 | 241.90 | 3.01 | 1.29 | 231 | 1.02 | 1 | 2 |
| Th_ppm | 10.90 | 10.89 | 8.56 | 14.72 | 0.95 | 8.74 | 11 | 0.99 | 1 | 4 |
| Ti_% | 0.33 | 0.33 | 0.30 | 0.35 | 0.01 | 2.83 | 0.34 | 0.97 | 1 | 0.005 |
| V_ppm | 114.85 | 114.85 | 109.92 | 120.99 | 2.06 | 1.80 | 112 | 1.03 | 1 | 2 |
| Y_ppm | 15.01 | 14.99 | 13.64 | 17.77 | 0.55 | 3.68 | 18 | 0.83 | 1 | 2 |
| Zn(tot)_ppm | 101.03 | 100.66 | 94.97 | 118.68 | 2.84 | 2.81 | 106 | 0.95 | 1 | 2 |
The results of analyzing standard reference materials are favorable. It may be inferred that the methods and laboratories used to analyze the standards, and therefore the stream-sediment and soil samples, performed well for the majority of elements.
Some geochemical boundaries are visible on the geochemical grids. The reasons vary, but in the case of scandium, niobium, yttrium, and lead (Pb(part)_ppm), the Humboldt analyses consistently underestimated the certified concentrations and most likely the sample concentrations. Within the Humboldt analyses there is a very distinctive molybdenum (partial and total analyses) and chromium boundary anomaly. The analytical results of the stream-sediments and soils appear uniformly enriched across the Humboldt samples when compared to samples from the Winnemucca-Surprise and Malheur-Jordan datasets. This elevation in molybdenum and chromium concentration is mostly likely due to contamination of the samples during sample preparation by a stainless-steel shatterbox. Therefore, any interpretation of molybdenum and chromium grids (and geochemistry) should be done cautiously.
Another area of concern is in the Ely quadrangle, where most of the arsenic values (partial and total) are anomalous compared to the rest of the grid. This block of high values can be explained by reviewing the SRM analyses; they reveal that the laboratory generally overestimated the certified value of the standard by 32 percent. Again, caution is advised while interpreting the arsenic grids within the Humboldt study area.
In some cases differences can be "leveled out" by applying correction factors to the sample dataset; however, for most elements in these study areas, the statistical summaries indicate that statistical corrections or standardizations may not be necessary.

![]() U.S. Department of the Interior |
U.S. Geological Survey
U.S. Department of the Interior |
U.S. Geological Survey
URL: http://pubsdata.usgs.gov/pubs/of/2002/0227/quality.html
Page Contact Information: GS Pubs Web Contact
Page Last Modified: Wednesday, 07-Dec-2016 19:26:27 EST
