Geography and Map Division
Library of Congress
101 Independence Ave, SE
Washington, DC 20740-4652
Telephone: (202) 707-8530
Fax: (202) 707-8531
e-mail: ccah@loc.gov, grob@loc.gov, dschu@loc.gov
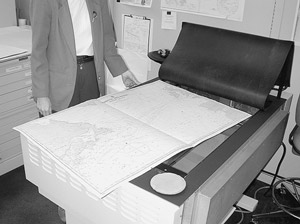
In January 1995, the Geography and Map Division's Center for Geographic Information was founded, composed of leaders in the cartography and computer industries. On advice from the Center partners, electronic mapping was divided into two broad categories: "born digital" materials and the digitization of historic items; this paper focuses on the latter. The Center for Geographic Information proved a rich source of not only advice but also material support. Several members loaned or donated equipment and software: among these was software from ESRI and Macromedia Corporation, computer hardware from Hewlett Packard, and a large flatbed scanner from Tangent Imaging (Figure 1). It took several months to set up work space, gather and train staff, and begin scanning.
|
Figure 1. Tangent flatbed scanner. |
|
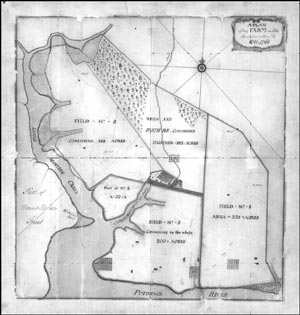
Figure 2. George Washington, 1766, A plan of my farm on Little Huntg. Creek & Potomk. |
Because of this early work with digital mapping, the Geography and Map Division was in a strong position to be a major player in the Library's World Wide Web effort, the American Memory project. In a major commitment to provide 5000 maps, the Division began scanning historic materials from its collections, which consist of 4.6 million maps, 60,000 atlases, plus globes, relief models, and more. Whereas the American Memory project focused on materials about the United States, the Division anticipated the need for materials to support presentations on immigration history and patterns, and so early in the project the Division began scanning maps on locations outside the United States.
Once the tools for scanning were in place, a selection of what would be scanned was the next priority. There are several well-known cartobibliographies produced by the Division: the first set of maps scanned were those from the Panoramic Maps of the United States and Canada, compiled by John Hébert and Patrick Dempsey (1984). This scanning of published bibliographies was chosen as the criteria that are still used today: these are popular items, they are out of copyright, and they already have catalog records. The first two criteria are self explanatory; the third criterion reflects the fact that cataloging a map can become the most time consuming part of getting maps online.
Part of the learning curve in this project was setting up a smooth workflow, because putting a map on the Internet requires more than just pulling it from the collections and scanning it. It was quickly realized that the entire Geography and Map staff played a part in posting digitized maps on the Web. All staff provided advice on the selection of materials; the final decision was made by the Chief and collection curators. A collection technician would pull and prepare the item for scanning. The Digital Team then scanned the item, processed the image, moved the files to their appropriate location, gathered metadata, added or updated cataloging information to the Library's database, and ensured all the pieces were in place before the image became available on the Internet. Collection curators created introductory descriptions for online presentations and assisted in determining Web navigational needs. This workflow slowly improved over several years. Even today, the process is being altered by changes in technology and the increased experience of the staff.
This entire process requires coordination and cooperation, not only within the Division, but with other staff in the Library. If a map needs repairs, it is sent to the Conservation Lab for expert treatment. The majority of the Web-page design is completed with the assistance of the National Digital Library staff, who create Web pages and graphics, edit text, and give technical support to make the Map Collections Web site a reality.
Wherever possible, the Division favors a graphic interface for navigation, as most users want to look at a certain country, state, or city (Figure 3). To help reduce the number of maps to be searched, several subsections were developed. There are seven general themes, giving the user a guide for finding a map (Figure 4): Cities and Towns, Conservation and Environment, Discovery and Exploration, Cultural Landscapes, Military Battles and Campaigns, Transportation and Communication, and General Maps. Under these themes are housed special presentations on such diverse subjects as Railroad Maps, Mapping the National Parks, and the American Colonization Society's maps of Liberia. Each level has its own search capabilities and a map will appear in more than one theme, if appropriate.
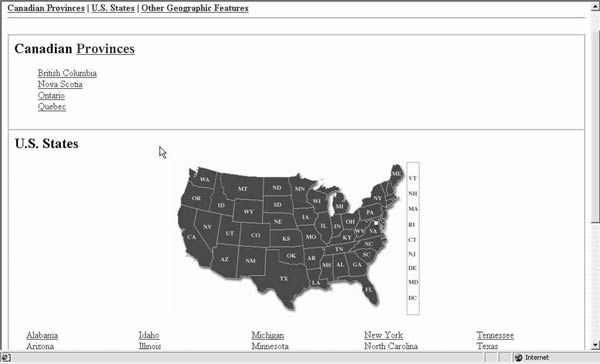
Figure 3. Graphic interface to aid in finding a map. |
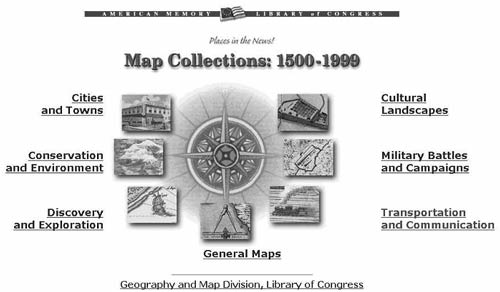
Figure 4. Map Collections Web page. |
After finding a map, the user is presented with the bibliographic record of the item and a thumbnail view to give some idea of what the map looks like. Clicking on the thumbnail retrieves the MrSID interface, showing a Zoom View and a Navigator View (Figure 5). The small Navigator View is especially useful for large files, allowing the user to know where they are in an image. MrSID also allows a user to explore the map in detail, print the various views, and even download the file. The Division was fortunate to have LizardTech as a partner in its Center for Geographic Information, as the MrSID software met all the requirements for online viewing of maps. The ability to zoom in and out and view such amazing detail, greater than possible with the naked eye, was a great advantage. All of the work to generate these images is accomplished at the Library of Congress server and no special software or plug-ins are required at the user's end. Even an older version Web browser, such as Netscape 3.0, will access these images just as easily as a graphic browser made today. The compressed files are small enough to allow for easy download if a user wants to view the image offline and, with free software from LizardTech, users can insert MrSID files into documents and databases.
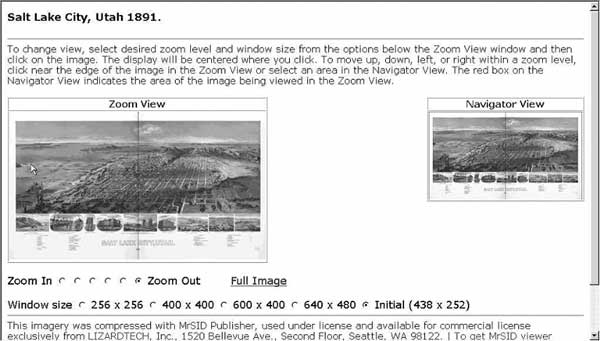
Figure 5. MrSID display. |
The bibliographic record is one of two kinds of metadata supporting the online images. It allows for name, title, and subject searching and gives the user information about the original map. All of the Division's online maps have a catalog record in the Library's online database, at http://catalog.loc.gov/. The records are available in American Memory and the Library of Congress online catalog; both of these databases allow you to search and retrieve digital maps. A link on the online cataloging record takes the user to the thumbnail and bibliographic information within American Memory. The Digital Team also maintains a Microsoft Access database of structural and administrative metadata. There are many uses for these data, including workflow tracking, error checking, and statistical reports.
|
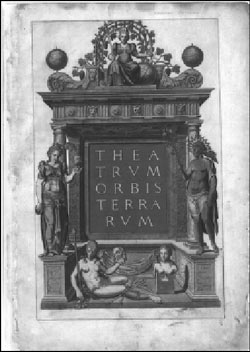
Figure 6. Abraham Ortelius, 1570, Theatrum Orbis Terrarum. |
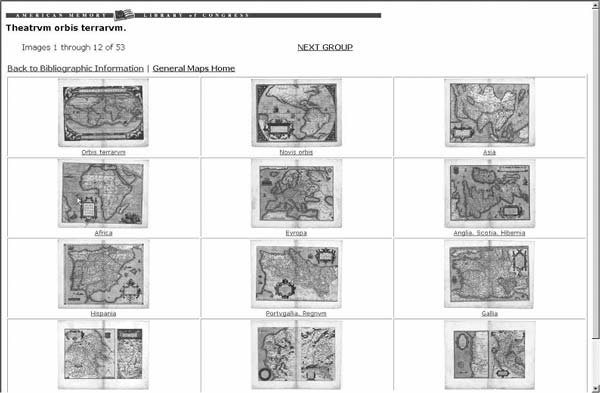
Figure 7. Contact sheet of images. |
With the first scanning project, a major challenge was encountered with the panoramic maps. The Pictorial St. Louis (Compton, 1876) was a panoramic atlas consisting of 110 pages. If laid out by the key map, these sheets would form a large wall map. Display was an issue, and the creative talents of David Woodward, a programmer on the American Memory project, found the solution. The key map became a base for a Web image map (Figure 8). An Access database identified for the system the relationship of each sheet to its surrounding pages. The user could select any map to start, and once the MrSID image loaded, a grid below the Navigation View allowed free movement to all adjoining maps (Figure 9). This tool allows the Division to manage related maps in a logical, user-friendly manner. Through the use of MrSID world aggregation files, which tile multiple TIFF files into one compressed image, there are no size limits on compressing files for Internet viewing. The Digital Team has MrSID files that represent more than 4 gigabytes of data.
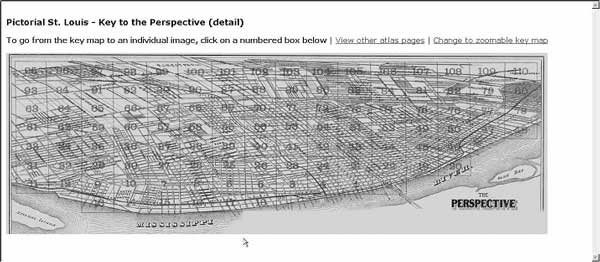
Figure 8. Image map made from key map of Pictorial St. Louis. |
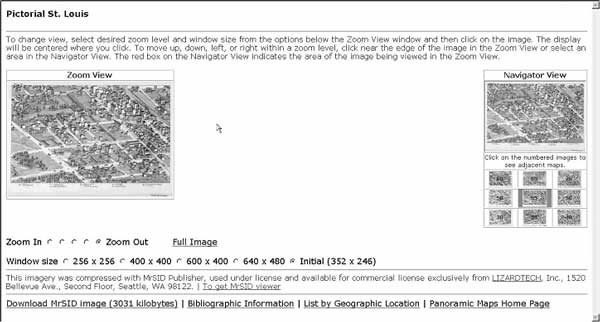
Figure 9. Grid for navigation of adjoining maps. |
The present setup limits the Division to scanning flat items; however, in the near future we may try to scan bound atlases. Most of the atlases currently online were either disbound or scanned by other Library staff with a PhazeOne camera. The Division is investigating onsite scanning of books. Always looking ahead, the Division is investigating scanning of 3-D items, such as globes, to make all its holdings available on the Internet.
We hope you will visit the Map Collection web site at http://memory.loc.gov/ammem/gmdhtml/gmdhome.html and the Geography & Map Division Web site at http://lcweb.loc.gov/rr/geogmap/gmpage.html to view the online cartographic materials.
Hébert, J.R., and Dempsey, P.E. (revision author), 1984, Panoramic maps of cities of the United States and Canada: Library of Congress, 181 p.
Ortelius, Abraham, 1570, Theatrum orbis terrarum: Apud A.C. Diesth.
Washington, George, 1766, A plan of my farm on Little Huntg. Creek & Potomk.