
Digital Mapping Techniques '02 -- Workshop Proceedings
U.S. Geological Survey Open-File Report 02-370
Compilation of a 1:24,000-Scale Geologic Map Database, Phoenix Metropolitan Area
By Stephen M. Richard and Tim R. Orr
Arizona Geological Survey
416 W. Congress #100
Tucson, AZ 85701
Telephone: (520) 770-3500
Fax: (520) 770-3305
e-mail: Steve.Richard@azgs.az.gov, Tim.Orr@azgs.az.gov
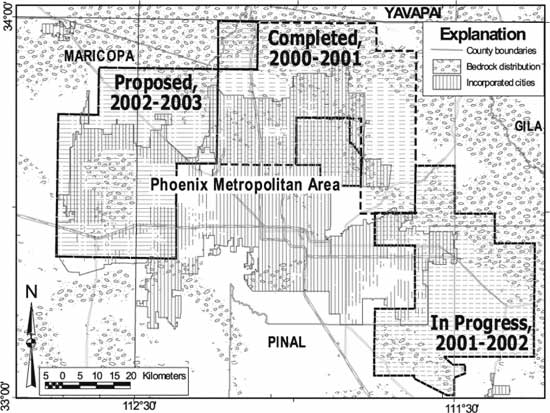
The Arizona Geological Survey (AZGS) has embarked on a program to compile and release digital geologic map data for the Phoenix metropolitan area (Figure 1). This project is motivated by the fact that the Arizona geologic mapping advisory committee voted overwhelmingly in favor of detailed (1:24,000-scale) geologic data production as opposed to 1:100,000-scale compilation. More detailed geologic information is required for engineering and environmental applications in the rapidly urbanizing metropolitan area. The goal of the 1:24,000-scale compilation is to provide a geologic map database that is as accurate and up-to-date as possible, based on a consistent set of geologic map units across the entire compilation region.
|
|
Figure 1. Compilation plan, Phoenix metropolitan area.
|
In conjunction with existing 1:100,000- and 1:1,000,000-scale digital geologic data, our goal is to make geologic map data available at several scales through a single ESRI ArcView 3.2 project. Initially, the thematic geology data included in the database are very simple, with geologic unit information designated using a single geologic-unit identifier associated with each polygon. Lines are classified in a simple scheme recognizing various kinds of faults and nonfaulted contacts between units. Users must refer to published source maps for a more in-depth description of the geologic features. As standardized data models and software tools evolve (see Boisvert and others, Progress Report: North American Geologic Map Data Model Design Team, this volume), we plan to progressively expand the thematic geologic content of the database to allow more sophisticated applications that tailor the geologic map presentation to the needs of the user.
COMPILATION MECHANICS
Geologic map source data for much of the compilation area are available in original mechanical form (typically ink drafted on mylar) at the AZGS, because much of the mapping has been completed over the last 15 years by Survey geologists under the auspices of the U.S. Geological Survey-Association of American State Geologists National Cooperative Geologic Mapping Program. Digital map production at the AZGS has been implemented only in the last three years, after completion of mapping in the Phoenix area. Depending on the nature of the material available, source maps are either scanned and digitized on the computer screen ("heads up"), or digitized using a large digitizing table. Heads-up digitizing is done in operator-assisted mode using Able Software's R2V program if mylar separates containing only the linework are available. The output from R2V is converted to shape files, imported into Arc/Info coverages, and final editing, cleaning, and building of polygon topology is done using Arc and ArcEdit. If the original mechanical material consists of drafted linework on a screened topographic base map, the scans are digitized heads up using ArcEdit because the benefit of the autovectorization functionality of R2V is lost. Table digitizing is completed using ArcEdit to directly construct an Arc/Info coverage with topology. Data fields for the AZGS data structure (Richard and Orr, 2001) are added to the PAT and AAT tables in Arc. Line and polygon attributes for topologically complete coverages are then assigned using ArcView 3.2. Point structure data are digitized using a custom Arc Macro Language interface that automatically calculates the strike indicated by a structure symbol when the digitizer locates the ends of the symbol's strike line. Metadata associated with each point, line, and polygon, referred to as the feature-level tracking, record the provenance of all data.
The boundary of each source map is preserved as a polygon-bounding line, allowing the polygons derived from each source map to be shown with the source map bounding line. When the compilation is symbolized as one map, these source-map boundary lines are not symbolized.
Supporting metadata and thematic geologic data are stored in a Microsoft Access database. The structure of this supporting database system is described in Richard and Orr (2001). The key features of the database implementation are separation of the user interface ("front end") from the data tables ("back end"). The back-end data are stored in several thematic infrastructure databases, including metadata infrastructure, geoscience infrastructure, and cartography infrastructure. These infrastructure databases contain data elements used by all AZGS geologic map databases, including metadata such as person, organization, and project identification, feature-level metadata for infrastructure data, basic geoscience concept terminology for describing geologic occurrences, and description of standard symbology used for AZGS maps. Geologic data and metadata specific to the Phoenix area database are stored in a single back-end database specific to this project. The front-end database consists of a collection of forms, queries, and Visual Basic code for the user interface. Back-end tables are linked to the front-end database. This allows evolution of the user interface independent of the data.
COMPILATION ISSUES
Overlapping maps
In some parts of the compilation area, more that one source map is available. Following the standard procedure for map compilation, the compilers reconcile the various sources. This was simplified in many cases because the original geologists who created the source maps were not available to participate in the process. If, as part of this reconciliation process, the line work has been modified from the original source maps, the feature-level tracking for the edited lines notes the modifications made.
Reconciliation of Boundary Discrepancies
At the boundaries between source maps, geologic lines (contacts and faults) that clearly represent the same feature commonly do not precisely meet. In these cases the line locations have been adjusted by the compiler, and the location uncertainty of the lines (an attribute of each line) is updated to reflect the location discrepancy between the maps. Such discrepancies provide an operational indication of the actual precision of the source maps. A less common boundary problem is a contact that trends subparallel to the map boundary and, although in places it clearly must cross over into the adjacent map sheet, it is not mapped there. This requires the addition on the adjacent map of a geologic contact to close the polygon, which introduces a "sliver" polygon bounded by a geologic line on one side and a source map boundary line on the other.
Inconsistent Map Units
At the boundaries of some of the source maps, the unit designations between the two maps is so incompatible that no reconciliation is possible. In these cases, the source map boundary serves as a geologic polygon boundary. Table 1 provides examples of some of the incompatible geologic units for adjacent polygons across source map boundaries.
Table 1. Comparison of unit name incompatibilities across map boundary.
| Map 1 |
Map 2 |
|
Andesite
|
Chalk Canyon Formation
|
|
Andesite
|
Subaqueous lava complex
|
Argillite, siltite, and
argillaceous sandstone
|
Metasedimentary rocks
|
|
Chert
|
Metasedimentary rocks
|
|
Chert
|
Felsic metavolcanic rocks
|
|
Felsic metavolcanic rocks
|
Green argillite
|
|
Green argillite
|
Metasedimentary rocks
|
|
Mafic (basalt-ultramafic)
|
Metavolcanic rocks
|
New Unpublished Mapping
In several parts of the compilation area, AZGS geologists have completed new geologic mapping that is as yet unpublished. Because our goal is to provide the most complete, accurate, and up-to-date information, we have used the new mapping where available, and identified the source using the feature-level tracking record.
Multiple Map Views
We have used this compilation of the Phoenix area as a pilot project to develop methods to record multiple geologic-map visualizations based on the same database. Specifically, we wished to record, as nearly as possible, the original source geologic map. Most of the source maps consist only of black-and-white lines, with no color fill. All the maps used a compatible collection of fault and nonfaulted geologic-contact classifications, so only a single collection of line-type classification and symbolization is necessary. On the other hand, each source map includes a collection of geologic units, some of which are identical with those on adjacent maps, some of which may be correlated with those on adjacent maps, and some of which are unique. Thus, two visualizations are recorded in the database, one based on the legend from the original source map and one based on the compilation legend for the whole extent of the database. Both of these use the same symbolization for point structure data and geologic linework.
Map visualizations from the database are specified in the MapViewDefinition table (Figure 2). Each record in this table defines a map view through links to correlation tables that associate spatial objects with classification concepts and symbols (see Richard and Orr, 2001). The ViewSchemeTypeID defines which of several methods are used to select the spatial features to display and assigns symbols to the displayed features. The MapLegendID is used as an identifier to filter the relationship table to select links between the symbols used in the map view and classification concepts that define their meaning. ClassSchemeID identifies links between spatial objects and classification concepts that specify the geologic thing represented by the spatial object. SymbolSchemeID identifies links between spatial objects and symbols that directly specify how a particular feature is to be symbolized. The CatalogLinksDS identifies a data set that contains links of type "MapView components," linking the MapViewID with data set identifiers for all data sets required to construct the MapView. This structure provides a very general mechanism for representing the variety of approaches to composing a map visualization from the database.
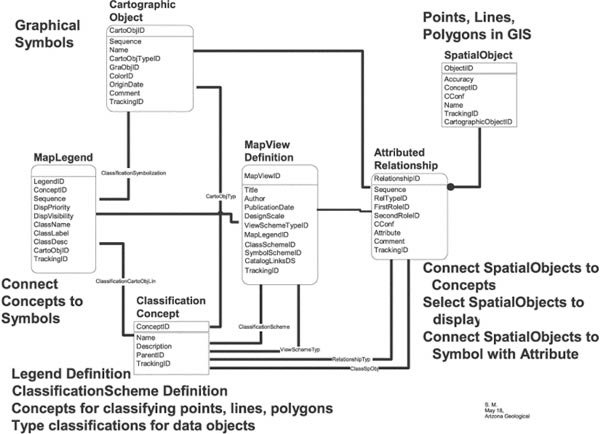
Figure 2. Map visualization represented by general relationship links between cartographic, classification, and spatial objects. Cartographic objects represent graphical elements (symbols) used to depict geologic features. Classification objects represent kinds of things (geologic units, faults, contacts, structure) and terminology used to describe geologic things. Spatial objects represent descriptions of geometry (location).
|
The AZGS database design includes a field to assign a default cartographic object to each spatial object in the database (Figure 2). Only one symbolization scheme is used for point structure data and geologic linework. For the northeast Phoenix metropolitan area database, we have assigned default symbols for geologic polygons based on the compilation map legend. The database includes a GeologicUnit table (a kind of ClassificationConcept table represented in Figure 2) that contains definitions of the geologic units from all the original maps, including the full text description of the unit. That table also includes definitions of all the compilation map units. The classification of geologic polygons on the original source maps is recorded in a classification scheme correlation (implemented in the AttributedRelationship table) that associates each polygon with its appropriate geologic unit. This correlation serves to select for display in the map view the polygons that compose the source map. A MapLegend correlation for each source map assigns CartographicObjects (symbols) for each geologic unit, based on the unit assignment for the polygon in the classification scheme for that map view. The points and lines to display in the view are selected by a Map View-Spatial Object correlation, implemented by instances in the AttributedRelationship table.
A geologic map includes many annotative features that convey the meaning of graphical elements on the map. The location of these annotative features is not determined by the location of a corresponding occurrence on the Earth, but rather by the requirements of esthetics and cartographic clarity. These include map-unit labels, name labels for named features, and a variety of symbols associated with lines that convey classification of the line (e.g., anticline symbol along fold hinge surface trace, teeth on thrust-fault trace). The location of such annotative features is recorded in the database in separate spatial data sets. Spatial objects in these data sets carry a CartographicObject identifier that specifies the graphical element located by that object. The northeast Phoenix area database currently does not include specification of these cartographic features for the map views that are represented.
INFORMATION DISTRIBUTION
Geologic map database products from the AZGS are distributed on CD-ROM, with an image that provides a rudimentary view of the map. The database publications are found in the Digital Information publication series, and each of these includes a version number. At present, the version numbers are in the form "m.n." The "n" number is incremented when data are added or updated. The "m" number is incremented when the data structure is modified by adding tables or redefining tables.
Some databases have one or more associated, fully decorated, digital map layouts as separate publications. These are titled "Geologic map of . . . ," and are included in the Digital Geologic Map publication series. The maps are subject to revision, indicated by including the word "revised" as a suffix on the publication date of any revised version of the map. The publication date on the map indicates the date of the most recent revision. The text associated with the map includes the revision history. The Digital Geologic Map series is treated differently from the traditional Geologic Map series because the authoritative, archival version for Digital Geologic Map Series maps is an Adobe Acrobat (.pdf) file on an archival CD-ROM, as opposed to a paper copy of the printed map in the archive.
IMPLEMENTATION PLAN
The first digital geologic map databases were released by the AZGS in 1997, using a data structure described in Richard and Thieme (1997). In that structure, metadata were presented as a separate data set, following the Federal Geographic Data Committee format. The thematic geologic information consisted simply of identification of geologic concepts for lines (contacts, faults of various sorts) and the map units represented by polygons. Development of the database design has continued, in conjunction with the evolution of ideas for a standard geologic map data model (Johnson and others, 1998; Brodaric and Hastings, 2000; Data Model Design Team, this volume). We now have implemented a robust feature-level metadata tracking scheme, while developing a logical structure to allow more in-depth representation of geologic knowledge (Richard and Orr, 2001). The framework for representing map visualization (cartography) has been developed and implemented, but we are only now beginning to populate databases to record this information. Because of the rapidly evolving nature of the standard framework for database representation of lithology, map units, geologic structure, and geologic history, these aspects have not been implemented for publication databases.
Current database development and implementation at the AZGS has been focused on the inclusion of field data produced in conjunction with mapping projects to archive a more complete record of the data collected in the field. Priorities for implementation in the near future include (1) implementation of the lithologic description, which will require development of standard terminology for many aspects of lithologic description (see http://geology.usgs.gov/dm/steering/teams/language/charter.shtml), as well as tools to allow data entry for structured descriptions of the complex relationships inherent in lithologic description; (2) integration of stratigraphic lexicon and geochronology into the information system as separate, but linked databases, and (3) development of tools for more flexible and user-friendly cartographic design by geologists. These tools are needed to accelerate development of publication quality layouts, and for data exploration and discovery--it's time to start actually using the information that's going into the databases!
REFERENCES
Brodaric, B., and Hastings, J., 2000, Evolution of an object-oriented, NADM-based data model prototype for the USGS National Geologic Map Database Project (abs.): Annual Conference of the International Association for Mathematical Geology, IAMG2001, Cancun, Mexico.
Johnson, B.R., Brodaric, B., and Raines, G.L., Hastings, J.T., and Wahl, R., 1999, Digital Geologic Maps Data Model, v. 4.3: U.S. Geological Survey and Association of American State Geologists, http://geology.usgs.gov/dm/model/Model43a.pdf.
Richard, S.M., and Orr, T.R., 2001, Data structure for the Arizona Geological Survey Geologic Information System-Basic Geologic Map Data, in Soller, D.R., ed., Digital Mapping Techniques '01--Workshop Proceedings, U. S. Geological Survey Open-File Report 01-223, p. 167-188, https://pubs.usgs.gov/of/2001/of01-223/richard2.html.
Richard, S.M., and Thieme, J.P., 1997, Data structure for Arizona Geological Survey digital geologic maps: Arizona Geological Survey Open-File Report 97-5, 15 p.
RETURN TO Contents
National Cooperative Geologic
Mapping Program | Geologic Division |
Open-File Reports
U.S. Department of the Interior, U.S. Geological Survey
URL: https://pubsdata.usgs.gov/pubs/of/2002/of02-370/richard.html
Maintained by David R. Soller
Last modified: 19:15:45 Wed 07 Dec 2016
Privacy statement | General disclaimer | Accessibility