
Digital Mapping Techniques '02 -- Workshop Proceedings
U.S. Geological Survey Open-File Report 02-370
MRLC2000 Image Data and Geologic Mapping
By Ronald R. Wahl and David A. Sawyer
U.S. Geological Survey
Box 25046, Denver Federal Center, MS980
Denver, Co 80225
Telephone: (303) 236-1320, (303) 236-1021
Fax: (303) 236-5349
e-mail: rwahl@usgs.gov, dsawyer@usgs.gov
Geologists traditionally have used aerial photography to help make geologic maps. Satellite imagery has been available to the geologic community only rarely, due to cost. Some investigations could afford to purchase such information but, commonly, good, clear, high-resolution satellite imagery was not available at any price. With the advent of the U.S. Geological Survey's Multi-Resolution Land Characteristics (MRLC) 2000 (now MRLC 2001) image data, these difficulties have been overcome for maps of 1:100,000 scale and smaller. These 30-meter-resolution data should also help at larger scales when sharpened by the included 15-meter-resolution panchromatic band.
BACKGROUND
Geologists from the U.S. Geological Survey (USGS) have for many years used imagery in one form or another to capture the information they thought interesting and important while investigating the geology of an area. Hayden (1883) in his 1878 report from the western part of the country used sketches and drawings as a way to portray the geology (including outcrops and fossils), vegetation, and the beginnings of Man's impact on the landscape (Figure 1). The image in Figure 1 has historical significance as well as scientific importance. The drawings in Hayden (1883) of the Pike's Peak, Colorado, area, Yellowstone National Park, and what would become Grand Teton National Park have great value in showing the state of the then-current environment as well as geologic phenomena.
At the first Digital Mapping Techniques workshop in Lawrence, Kansas, Wahl (1997) noted that the USGS was capturing geologic information by using aerial and oblique stereo photography in manual photogrammetry plotters. Since then, the USGS and others have acquired computer-based photogrammetry systems specifically for the capture of geologic information and are using imagery in these systems.
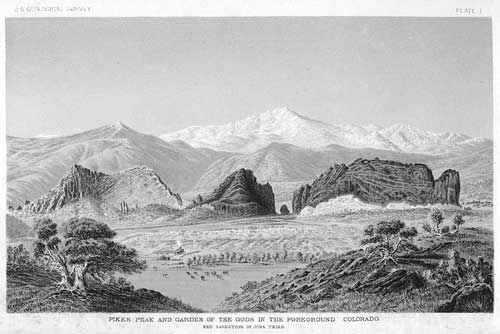
Figure 1. Pike's Peak and the Garden of the Gods, Colorado.
|
GEOLOGIC MAPPING AND IMAGERY
Geologic Information from Satellites
Geologic features are sometimes quite visible in satellite image scenes. Figure 2a is a small part of the Geologic map of Yellowstone National Park (U.S. Geological Survey, 1972) centered on Old Faithful geyser, and Figure 2b is approximately the same area from a Landsat 7 scene. The Landsat image is formed from bands 7, 4, and 1 (red, green, and blue). The hydrothermal alteration shows as various shades of blue (here as light gray to white). The intermediate gray patches are burn areas from the 1988 fire.
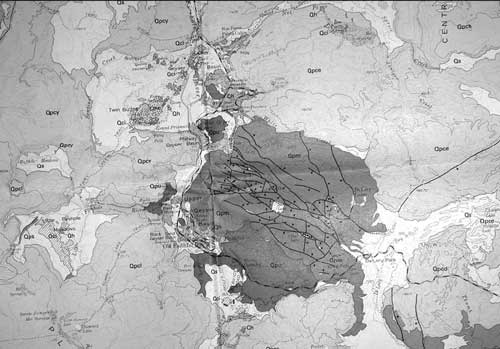
Figure 2a. A portion of the geologic map of Yellowstone National Park near Old Faithful Geyser.
|
Figure 2b. A portion of a Landsat image of roughly the same area as figure 2a.
|
Geologic Map Production
Figure 3 shows a 7-1/2-minute quadrangle produced from Landsat imagery. The geologic features were captured almost entirely from the image. More geologic maps are going to be compiled in the future using image data because the maps can be produced in a more timely manner and because the MRLC 2001 imagery will be able to show geologic features more clearly that other image formats, especially in semi-arid and arid regions.
Figure 3. A geologic map produced primarily from Landsat imagery.
|
Map Scales and Imagery
National Map Accuracy Standards state that the resolution of map features for 1:100,000-scale maps is about 50 meters. This means that because of line widths and the combination of thematic layers on a 1:100,000-scale map, features smaller than 50 meters in extent can't be drawn on such a map. Landsat image bands 1 through 5 and band 7 have a pixel size of 30 meters. Sharpened with a 15-meter-pixel panchromatic image, Landsat 7 data are quite usable at 1:100,000 scale. Larger scale maps may gain some advantage using such data, but feature resolution would be poorer.
MRLC2001 DATA AND GEOLOGY
MRLC 2001 data are terrain corrected and georeferenced Landsat 7 data ("Landsat 7+") that contain the following information:
- Bands 1-5 and 7 visible to long infrared, 30-meter pixels
- Band 6 thermal, 60-meter pixels
- Band 8 panchromatic (black & white), 15-meter pixels
- Band 9 digital elevation model (DEM) data, 30-meter cells
The DEM (band 9) data that cover the image area were extracted from the National Elevation Dataset (NED) and were the basis for terrain correction. Band 9 is composed of 16-bit (2-byte) integers rather than the 8-bit (1-byte) integers in the other bands. Band 9 is recorded with the bytes in reverse order from the order that a PC would expect.
The following description is from the current fact sheet for the new radiance-corrected data sets on the MRLC 2001 Web page:
MRLC 2001 Terrain Corrected/Radiance Adjusted Dataset Description
Multi-Resolution Land Characterization 2001 (MRLC 2001) [formerly MRLC2000] is a second-generation federal consortium to create an updated pool of nation-wide Landsat imagery, and derive a second-generation National Land Cover Database (NLCD 2001).
One of the challenges to large-scale satellite based land cover characterization is consistent geometric correction and normalizing noise arising from atmospheric effect, changing illumination geometry, and instrument errors inherent when using multiple frames of imagery. For those reasons, we have created a product with additional processing from the Terrain Corrected scenes.
This product is designed for regional applications where scene mosaics can be substantially improved by converting DN [digital number] to at-satellite reflectance to correct for Sun illumination angle effect. At-satellite reflectance images should be more appropriate for land cover and land cover change analysis than the original DN images. At-satellite reflectance also allows the development of a regionally applicable tasseled cap transformation using a physically based measurement. Overall, this method provides an important first-step to standardizing imagery, but users should realize that atmospheric, phonological, and topographic noise do remain. Atmospheric correction is not considered as a standard step in MRLC image processing . . . .
MRLC 2001 Landsat 7 data are currently available to all users. The data are to be used or disseminated with the intent of use for scientific purposes and only for a non-commercial venture.
This imagery is available to users in the USGS and cooperating agencies (e.g., the state geological surveys that participate in STATEMAP or other projects). MRLC2001 data can be obtained via the MRLC Web site at http://edc2.usgs.gov/lccp/mrlc2k/mrlc2k.asp, or they can be located via a search engine such as Google by typing "MRLC2001 data."
The cooperating agencies for the MRLC 2001 data are: USGS, U.S. Environmental Protection Agency (USEPA), U.S. Forest Service (USFS), National Oceanographic and Atmospheric Administration (NOAA), National Aeronautics and Space Administration (NASA), National Park Service (NPS), National Resources Conservation Service (NRCS), and the Bureau of Land Management (BLM). Our understanding is that any federal, state, or local agency that works with one of the above cooperating agencies can obtain this imagery.
USES OF MRLC 2001 DATA IN THE GREATER YELLOWSTONE AREA
Currently, we are compiling the 1:100,000-scale geologic maps for the 30 x 60 minute quadrangles that cover Yellowstone National Park. Most of the field mapping was done over the past 35 years. This effort will tie together new 1:100,000-scale mapping across the park. We acquired the MRLC 2001 data for the area to help in this compilation. The ARC/INFO coverages for the current park map (Christiansen and Wahl, 1999), along with coverages from the current compilation, were plotted over the image data. Figure 4 shows the image data with the new compilation work in white and the Yellowstone National Park geologic map coverage in light gray. This figure clearly shows relationships between the geologic features on the maps and the imagery even though the vegetation is quite heavy. Study of the imagery with the map coverage should yield a better compilation product.
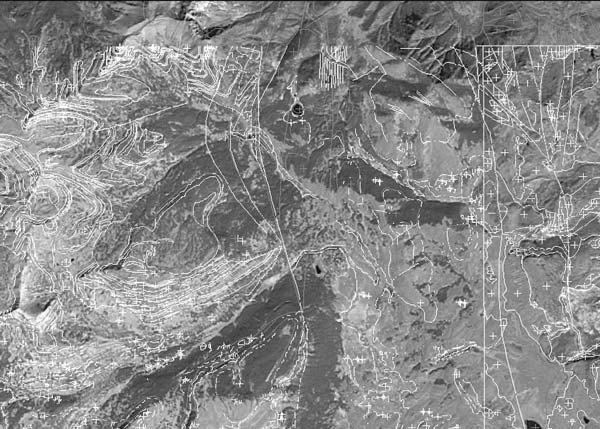
Figure 4. ARC/INFO coverages on top of Landsat 7 imagery of Yellowstone National Park.
|
CONCLUSIONS
Why use these data?
Because MRLC 2001 image data are terrain corrected and georeferenced, it is like an orthophoto but with more information from the large number of image bands. Each band or combination of bands can be converted to a GeoTiff image and then used in a program such as Adobe Photoshop. In arid or semi-arid regions and when merged with the 15-meter band-9 data, MRLC 2001 imagery may be useful for 1:24,000-scale mapping.
The cost of the MRLC 2001 data is quite reasonable. Each scene is $45 with a $45 processing fee per order. MRLC 2001 data is available for most of the lower 48 states and more images are added each week.
Difficulties in Using the Data
Several difficulties arise from trying to use Landsat 7 images as processed into MRLC 2001 data. Most significant is that they are available only in the USGS National Landsat Archive Production System (NLAPS) format. Not all image-processing software are able to process this data format yet, and significant effort is required to process the data into a useable format.
File sizes are quite large. All bands of one MRLC2001 scene are stored on two CD-ROM's. Data transfers of merged scene data (more that one image scene and all of the bands) may require either tapes or DVD's to keep the data on one piece of media. To use multi-scene images requires exceptional processing power from a PC.
The third problem is that this is a new area of exploration for geologists. The learning curve can be long and steep, but the new source of data will greatly add to the preparation of geologic maps and the result will be well worth the effort.
The Future of Imagery and Geologic Mapping
In the future, geologists will have many data and tools at their disposal, including more sensitive and higher resolution imagery. For example, one of the newer image data set types is ASTER (Figure 5). The following is quoted from the home page of the ASTER Web site at http://asterweb.jpl.nasa.gov/:
ASTER (Advanced Spaceborne Thermal Emission and Reflection Radiometer) is an imaging instrument that is flying on Terra, a satellite launched in December 1999 as part of NASA's Earth Observing System (EOS). ASTER is a cooperative effort between NASA and Japan's Ministry of Economy, Trade and Industry (METI) and the Earth Remote Sensing Data Analysis Center (ERSDAC). ASTER will be used to obtain detailed maps of land surface temperature, emissivity, reflectance, and elevation. The EOS platforms are part of NASA's Earth Science Enterprise, whose goal is to obtain a better understanding of the interactions between the biosphere, hydrosphere, lithosphere, and atmosphere.

Figure 5. ASTER image of the Grand Canyon, Arizona, draped over a digital elevation model. The image has the rock units classified by lithology.
|
REFERENCES
Christiansen, R.L., and Wahl, R.R., 1999, Digital geologic map for Yellowstone National Park, Idaho, Montana, and Wyoming and vicinity: U.S. Geological Survey Open-File Report 99-174, https://pubs.usgs.gov/of/1999/ofr-99-0174/.
Hayden, F.V., 1883, A report of progress of the exploration in Wyoming and Idaho for the year 1878: 12th Annual Report of the U.S. Geological and Geographical Survey of the Territories, pt. 1, 809 p., pt. 2, 503 p.
U.S. Geological Survey, 1972, Geologic map of Yellowstone National Park: U.S. Geological Survey Miscellaneous Geologic Investigations Map I-711, scale 1:125000.
Wahl, R.R., 1997, Digital geologic map data collection using photogrammetric and raster methods in Soller, D.R., ed., Proceedings of a workshop on digital mapping techniques: methods for geologic map data capture, management and publication: U.S. Geological Survey Open-File Report 97-269, p. 95-98, https://pubs.usgs.gov/of/of97-269/wahl.html.
RETURN TO Contents
National Cooperative Geologic
Mapping Program | Geologic Division |
Open-File Reports
U.S. Department of the Interior, U.S. Geological Survey
URL: https://pubsdata.usgs.gov/pubs/of/2002/of02-370/wahl.html
Maintained by David R. Soller
Last modified: 19:15:50 Wed 07 Dec 2016
Privacy statement | General disclaimer | Accessibility