
| |
|
|
This sequence is starting at the point where a gamma sample is being run and needs to be changed to a new sample.
|
DATA
ANALYSIS FOR GAMMA COUNTING
|
|
|
Start the Aptec software application. In Clark 416 there are 6
different icons, one for each specific detector. Detector #5 is the planar
detector. |
 |
|
This is what the screen will look like when opened. Up and down arrows can be used to change the vertical scale. The + and - keys can be used to zoom into specific areas. The space bar will hop to each successive region of interest (ROI). |
 |
|
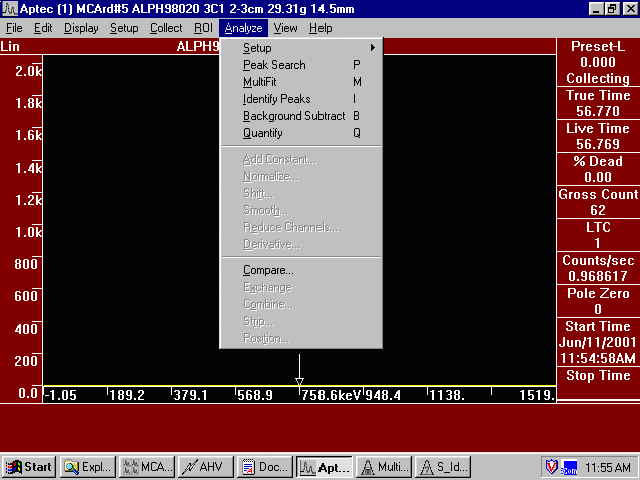
To fit the data, hit the
following keys: P, M, I (these commands are found under the Analyze
menu as "Peak Search", "Multifit", and "Identify
Peaks" respectively).
After doing so, check both
the Pb-210 and Cs-137 peaks for circles around a value indicating they
have been multifit.
The criteria for the peak search and other analyses can be found under the Analyze menu under "Setup" or by hitting shift-P, shift-M, and shift-I.
Middle photo shows a multi
fit peak. |
  |
|
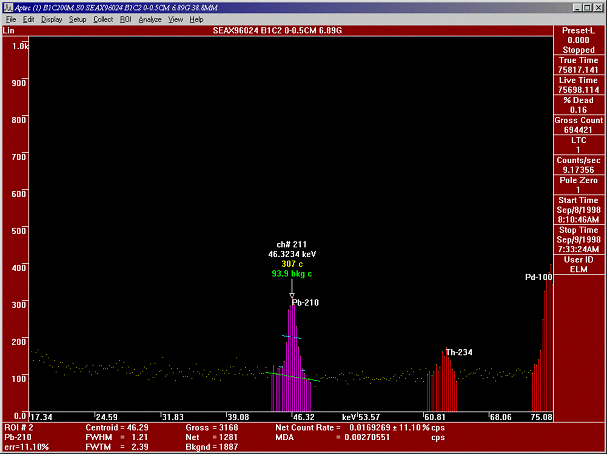
This is a view after the down arrow has been used. Double click in the black
area - use the space bar, as mentioned above, to hop to each successive
(ROI). As each ROI is highlighted, the isotope and associated data will
be displayed in the status bar at the bottom of the screen. Scroll
through to the Pb-210 and Cs-137 peaks and check the errors for those
peaks by checking the Status Bar at the bottom of the screen. |
 |
|
Write down the error values for Pb-210 and Cs-137 in the log book. Record all information in the log book and record the next sample. Measure the height of the
planar-type sample and record. |
|
| Go to the Collect menu and click on "Stop Collection". | 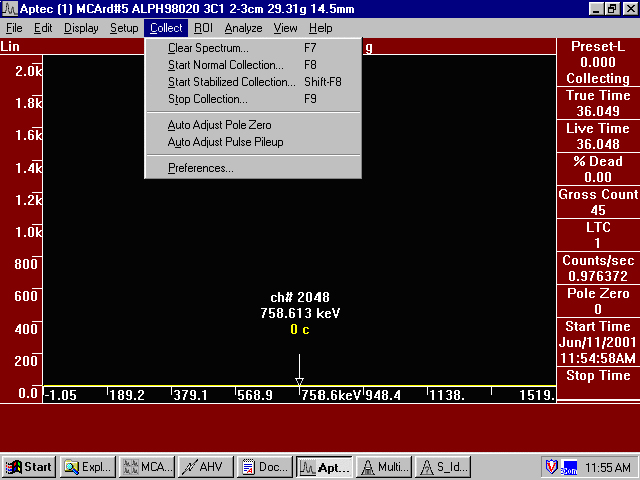 |
|
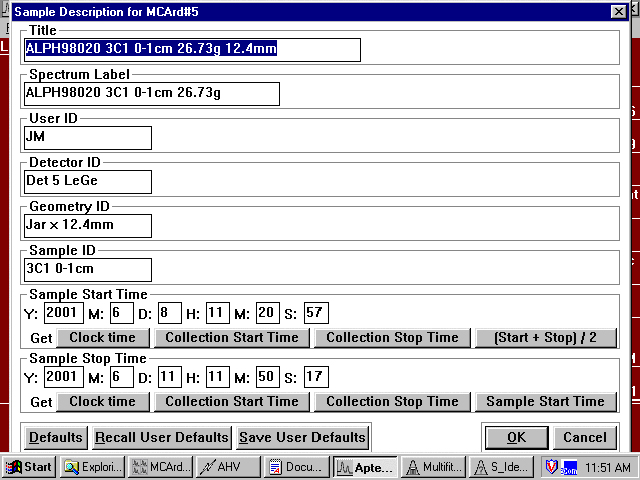
Hit the F5 key (can also be found under the Edit menu under "Sample Description") which will bring up the properties for this sample (cruise, core, interval, weight, height, user, etc...). Make sure everything is filled in for this sample (check values against the values recorded in the log book) and the start and stop times are filled in (this is done automatically by clicking on the collection stop and start icons). Hit the F6 key (can also be found under the Edit menu under "Quantity Description") and make sure the proper weight has been recorded. |
  |
|
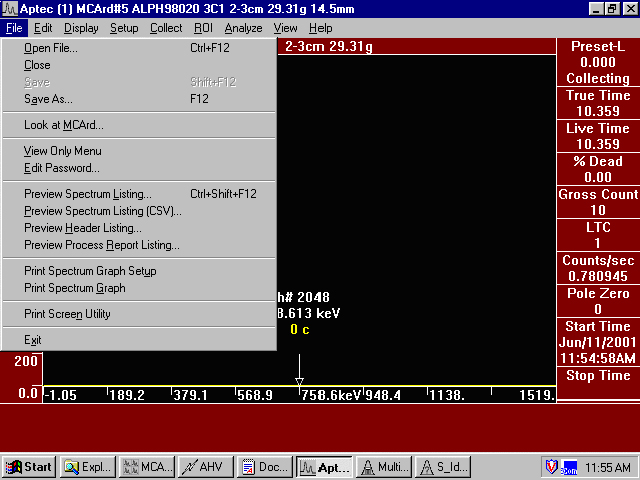
Go to the File menu and click on "Save As". Find the proper directory for the region, cruise, and core and save the file for this interval. The usual way to name a
spectra file is to put the core and the midpoint of the interval rounded
to the nearest whole number. Go to the File menu and click on "Open" to verify the file has been saved. |
  |
|
|
|
|
Go to Analyze, then Peak Search, then Analyze, then Identify Peaks, then save file again with the new name. Open the file just saved for the previous sample. |
|
|
Print the file by going
to the File menu and click on "Preview Spectrum Listing". This will open another window. Go to the File menu and click on "Print Listing". |
|
|
Print the file by going
to the File menu and click on "Preview Spectrum Listing (CSV)". |
|
|
Go to the File menu and click on"Look At MCArd" and go to the detector you were using. |
|
|
Go to the Collect menu and click on "Clear Spectrum". This clears the data from the last interval. Hit the F5 key and input the parameters for the new sample. Hit the F6 key to enter the sample weight. |
|
|
Put the sample in the detector. *This picture depicts a Planar Gamma sample in the detector. |
 |
| Once all the parameters have been entered, return to the Collect menu and click on "Start Collection". | |
| Type
in the new information for the next gamma sample.
|
|
| |
 Return
to Index
Return
to Index |