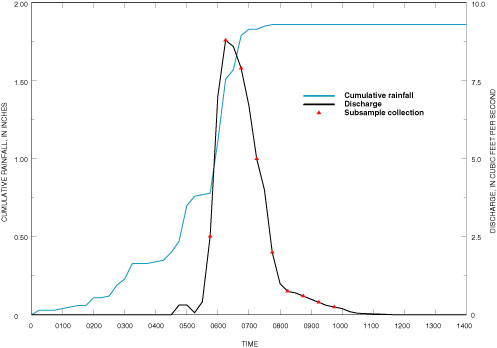
Figure 2. Hydrograph showing rainfall, discharge, and subsample-collection timing at watershed site 2 during storm event, August 30, 2001.
| Back to Table of Contents | Data Collection Methods | Figure 3