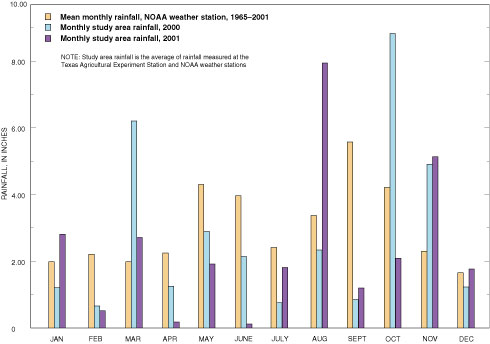
Figure 3. Mean monthly rainfall at National Oceanic and Atmospheric Administration (NOAA) weather station, 1965–2001, and monthly study area rainfall, 2000–2001.
Back to Table of Contents | Hydrologic Conditions | Figure 4