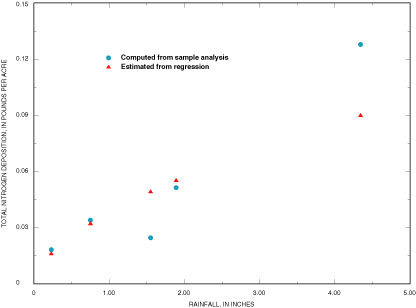
Figure 4. Comparison of computed and estimated (from regression) total nitrogen deposition for sampled rainfall events, June 2000–August 2001.
Back to Table of Contents | Hydrologic Conditions | Figure 5